Back to Trade Signals
market-updatetrading-signal
The Dip of the Dippity Dip?
The Dip of the Dippity Dip? - Read the full update on Zelf Trade.
Samuel Castellanos•
The Dip of the Dippity Dip?
What a drop and arguably the best buying opportunity this quarter.
How much lower can it go? A question of fear and desire for lower prices that left many on the sidelines wondering if it was the right thing to do. Let's try to be more rational, as there are signs of a bottom. Don't worry, most of the alts were decimated since early March and are just catching up with Bitcoin's reaction at $50,000. We'll focus on the cryptocurrency market as a whole and point out the obvious for non-believers and TLDR crowds.
Let's start with Big Daddy:
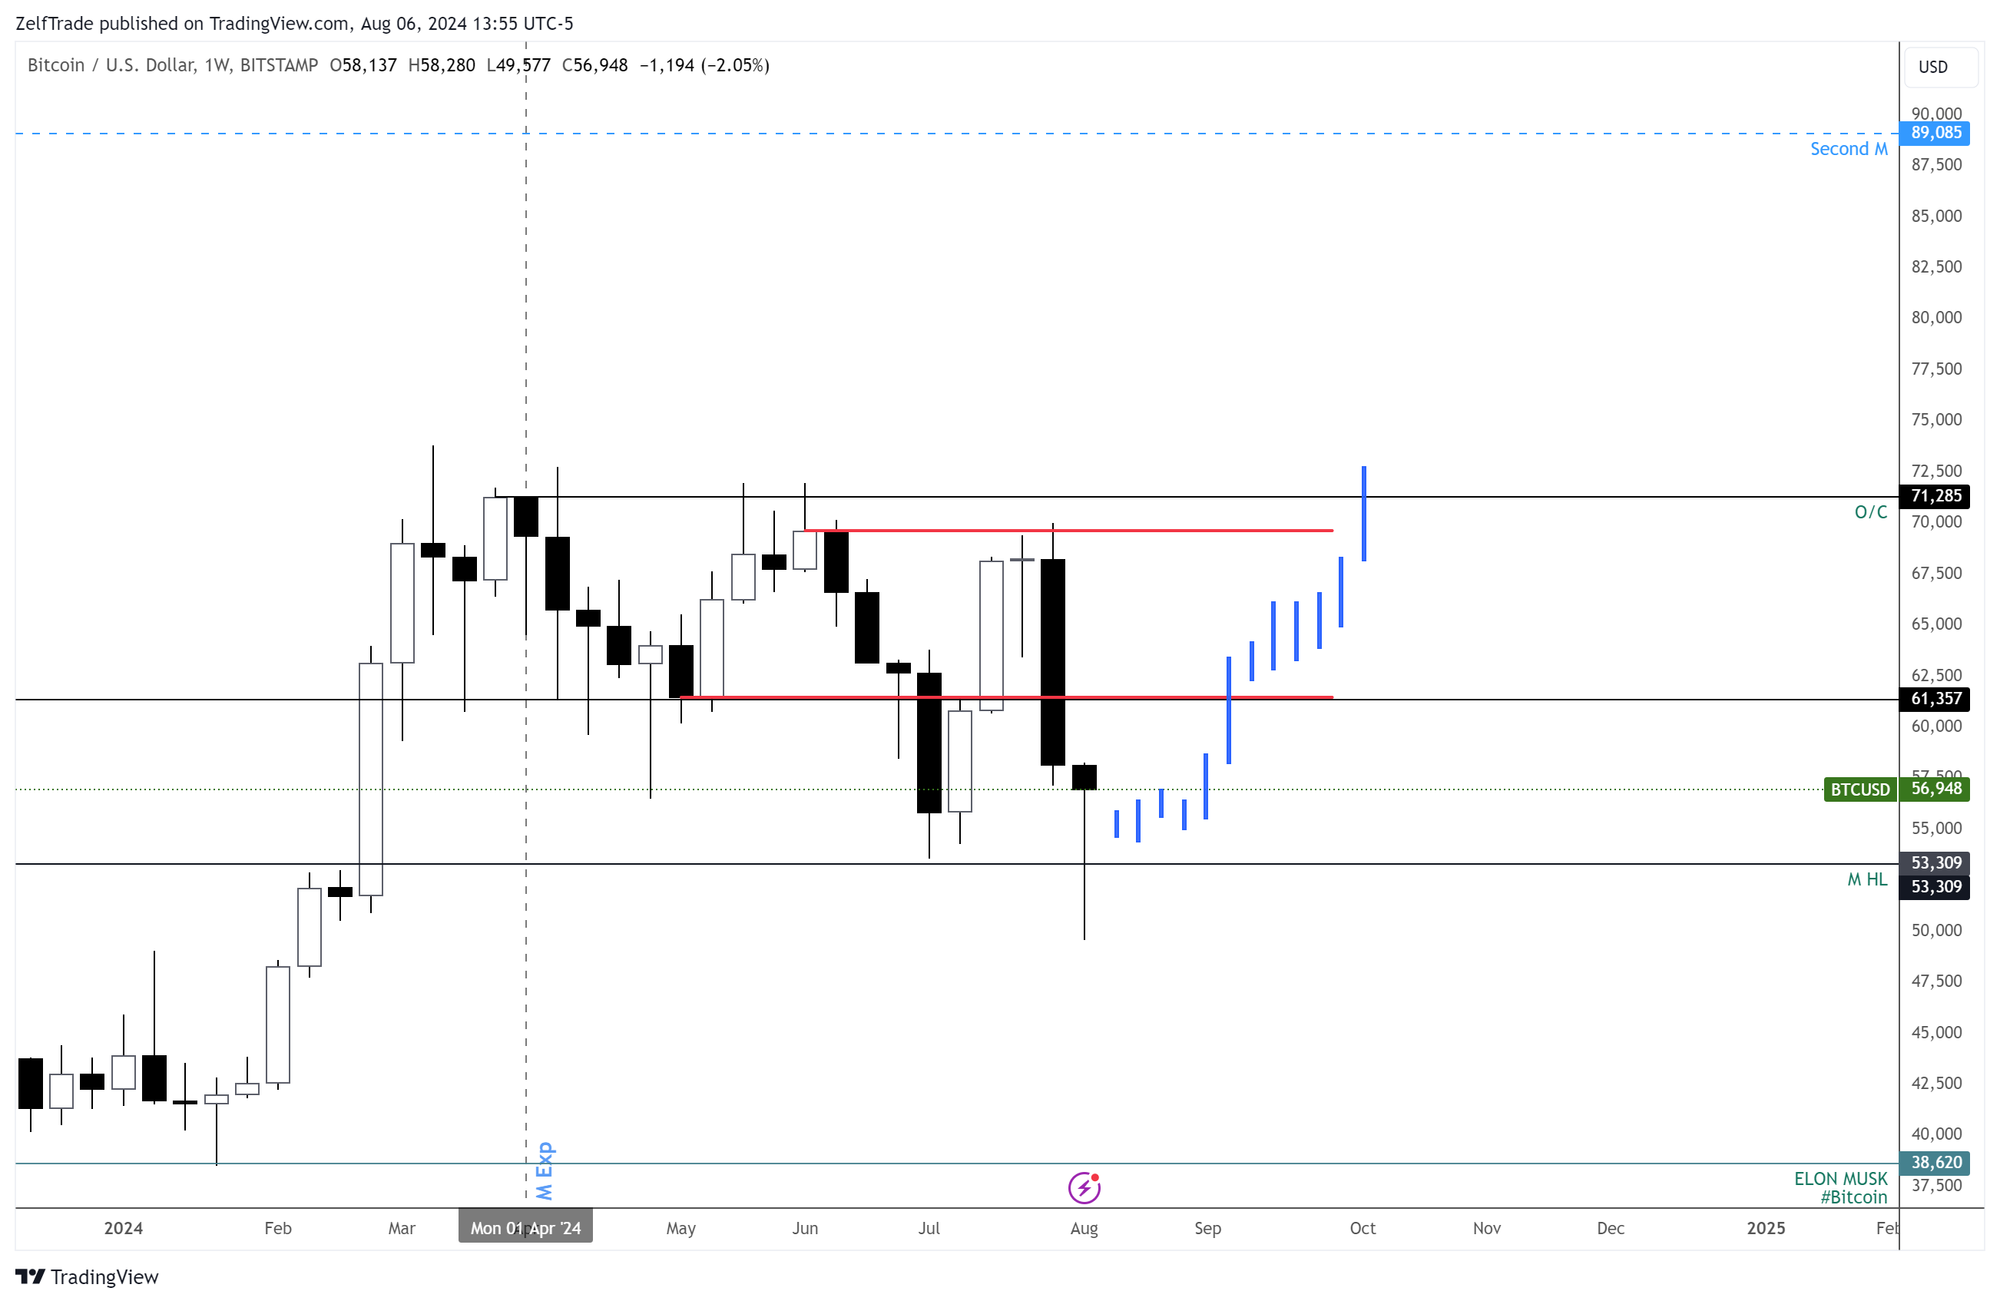
Things look even better than they did three weeks ago, when the bitcoin price was making a lower high and sentiment was exceedingly bullish for a July breakout, regardless of the '23 consolidation phase.
Price Projection
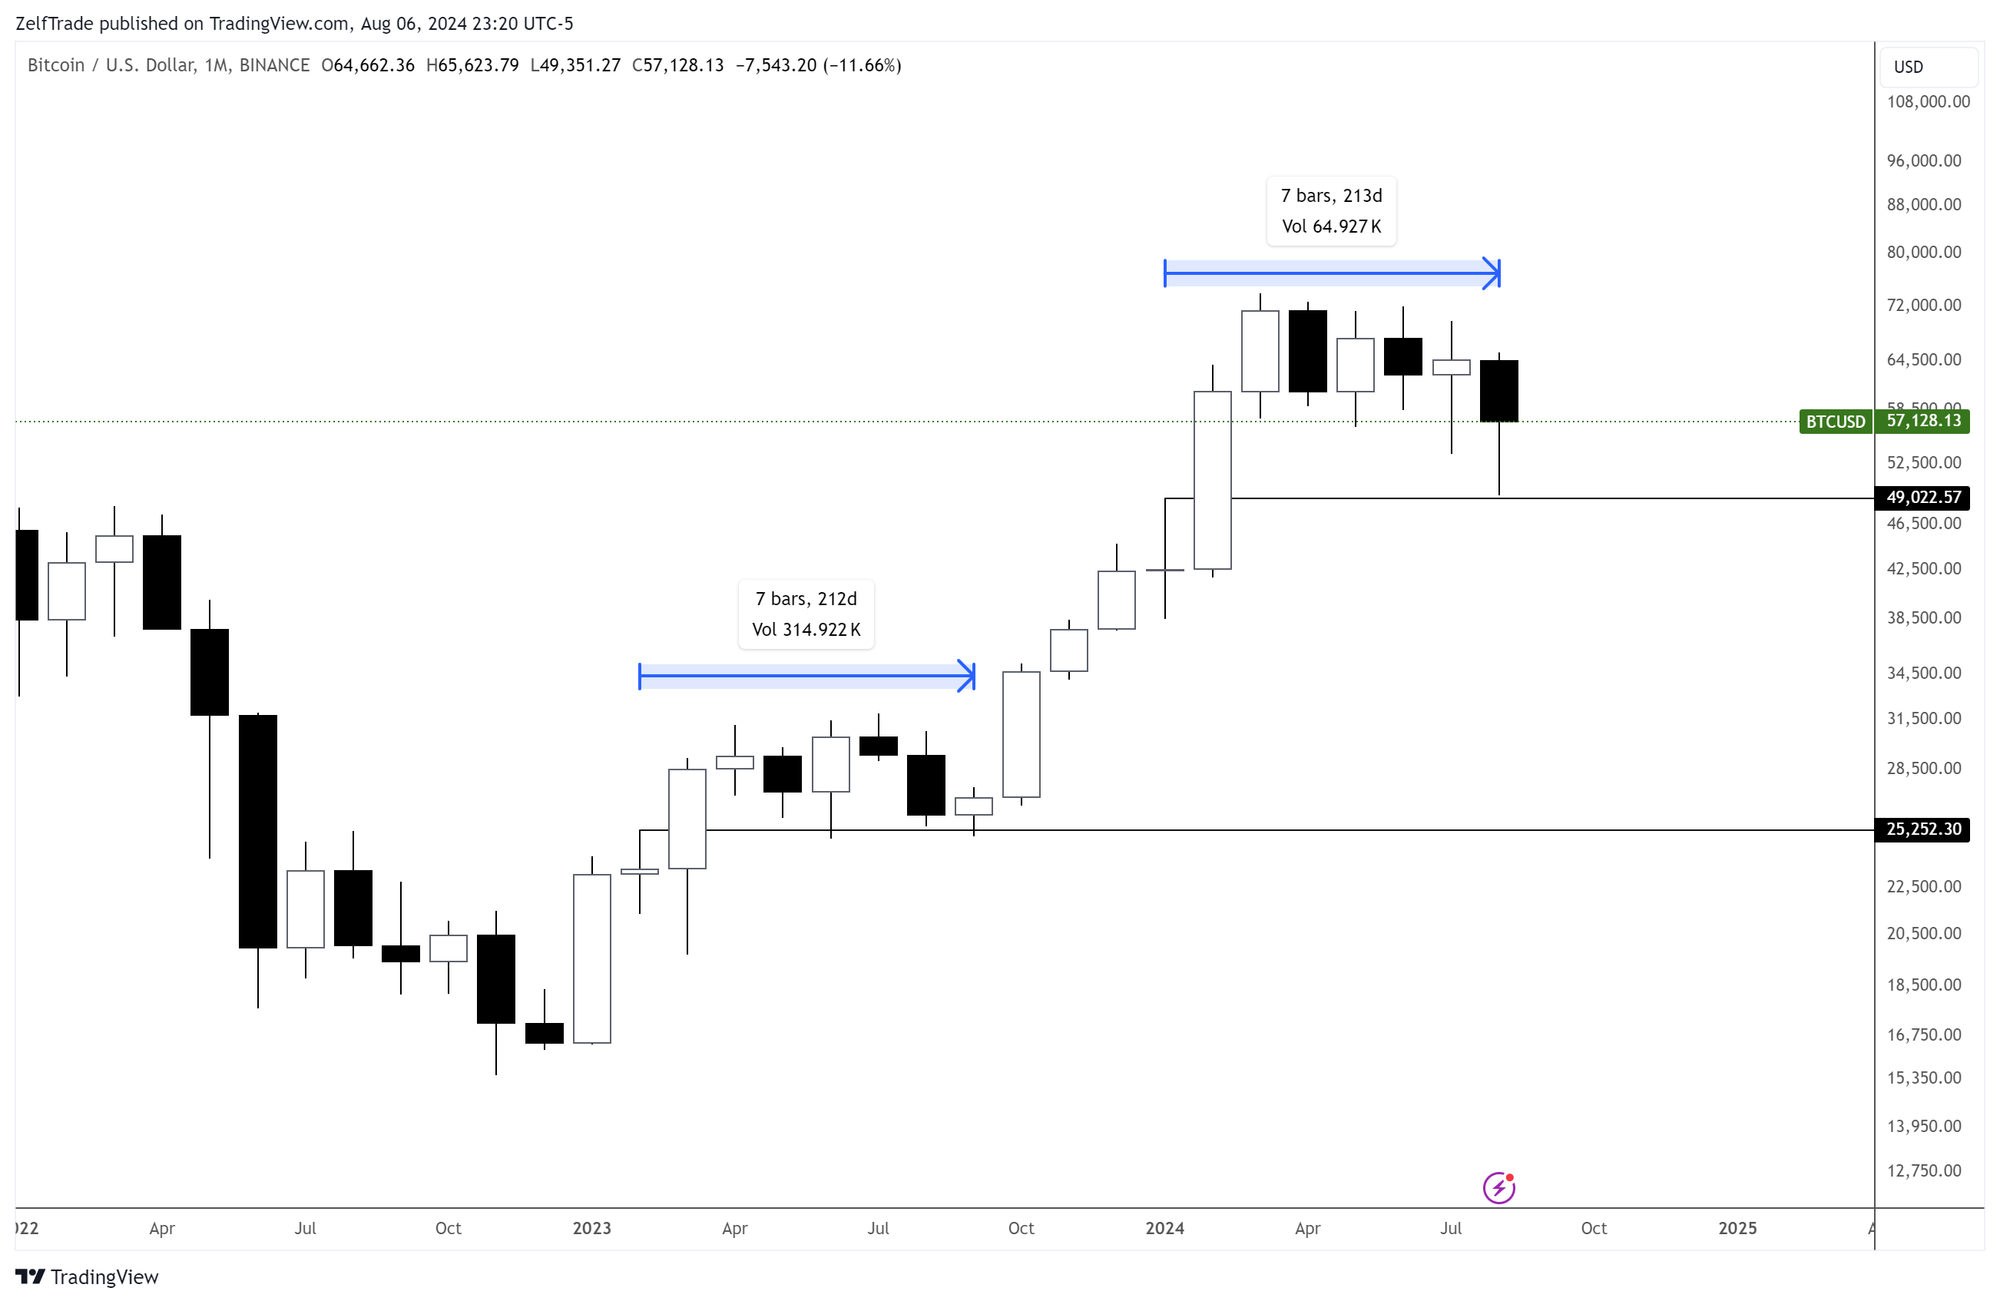
- First, the '23 consolidation lasted 7 months before the massive expansion candle.
- Second, the price never retraced beyond the classic mid-level.
- Third, the retracement level reached the high of the previous consolidation cluster, triggering the bottom within that slow period (March '23 - September '23).
Similarities between the two consolidations
I can continue to point out the similarities of both phases. But the most important one is the time based consolidation. Bitcoin has finally reached a 7 month phase with the possibility of even extending it into September to make it the 8th month of a likely extended move. Why is this so important compared to the other key points above? Time based consolidations that mimic the same pattern after an expansion of the previous one just means a higher probability of price continuation without a false breakout.
Now that the similarities are out of the way, let's add a little more hopium with previous fractals:
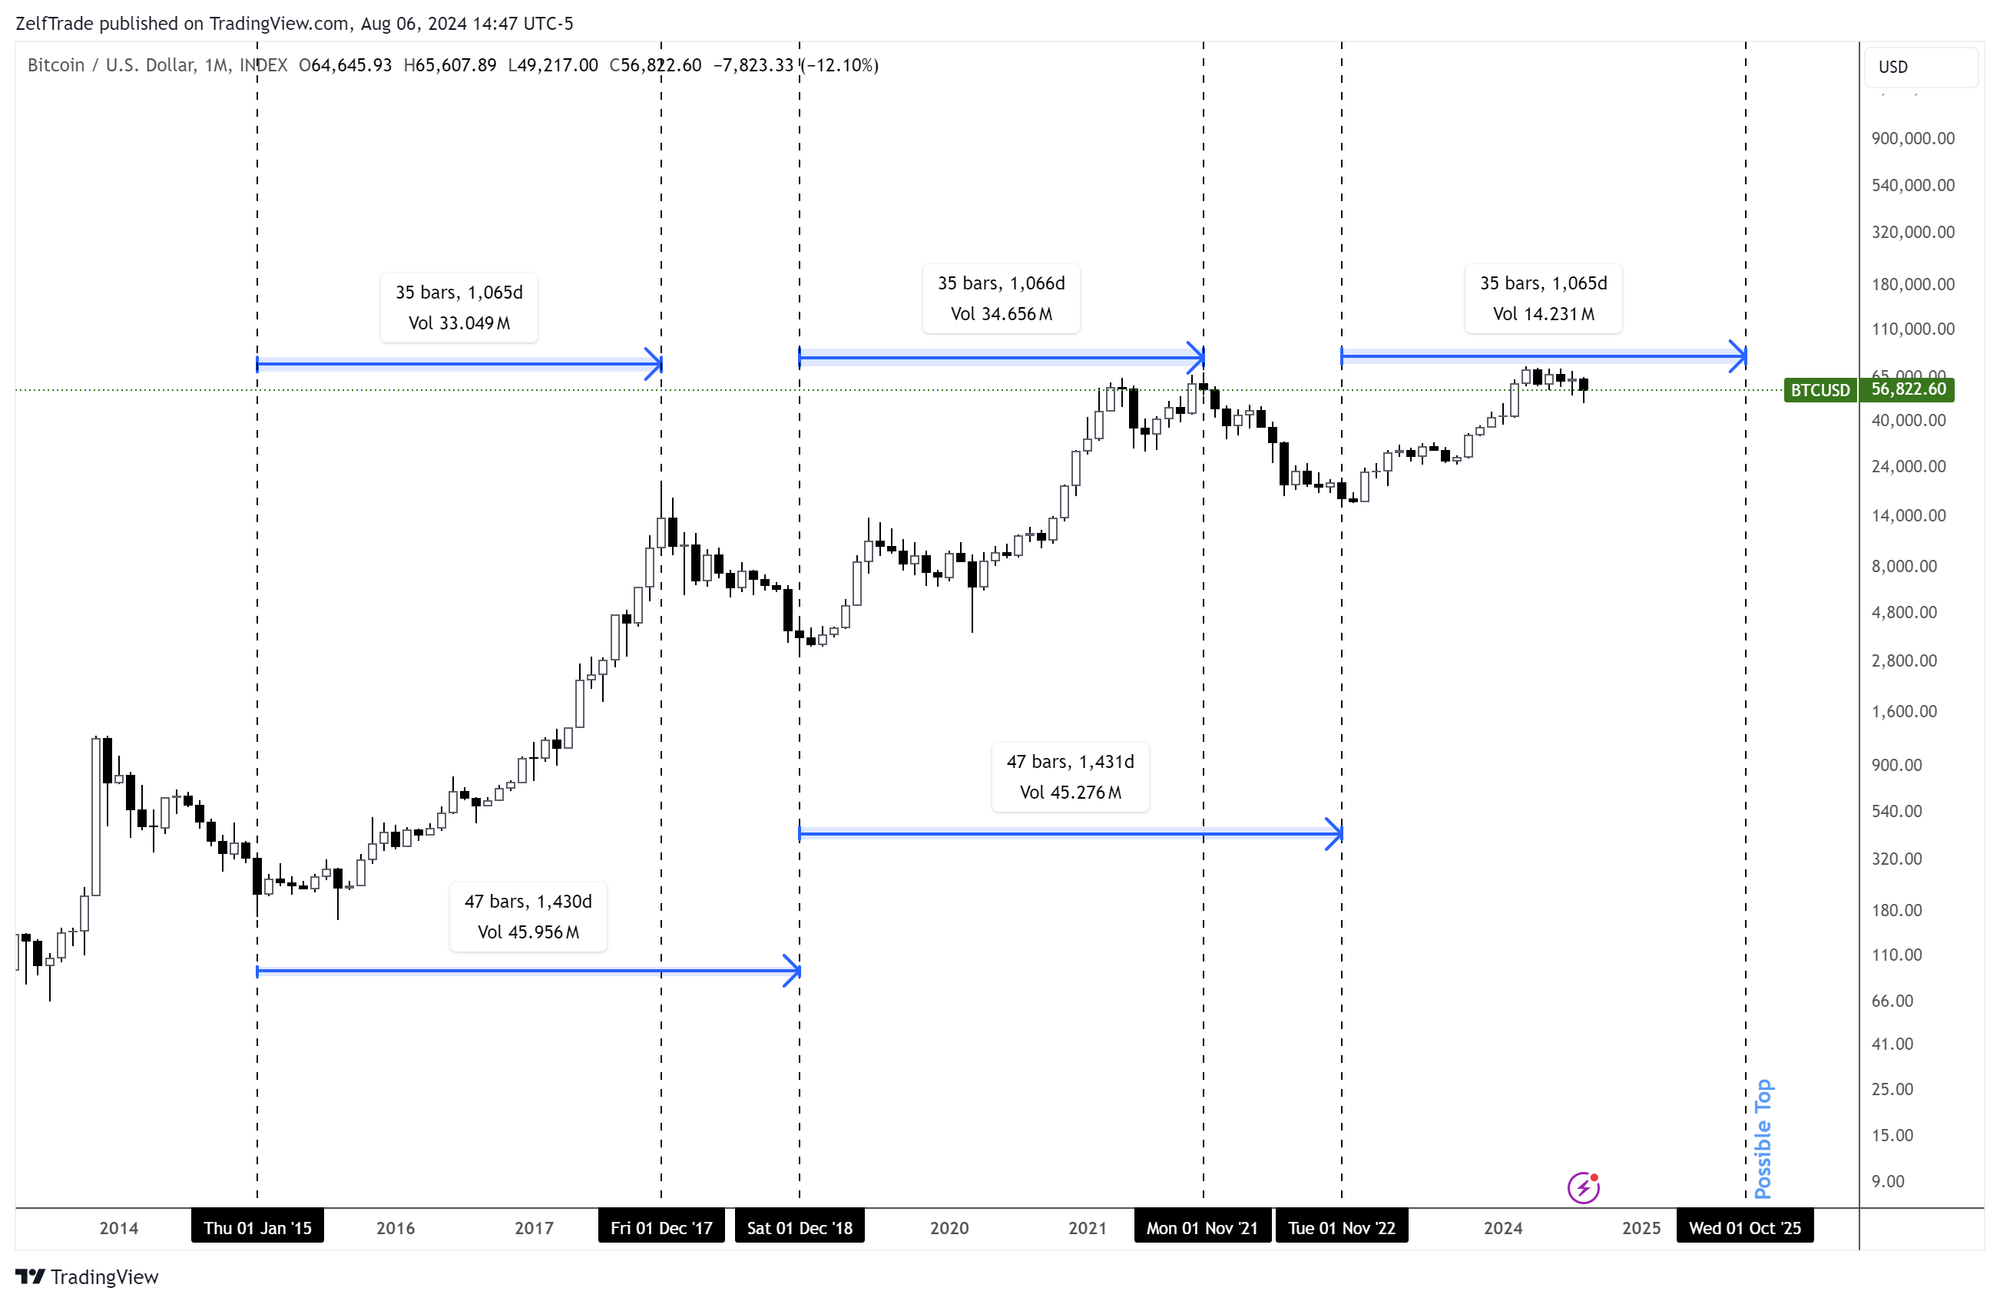
Bitcoin Cycle Fractals
Pretty self explanatory with the above illustration with this being a repeat of the previous two bull cycles. If this is the case then everyone should be looking to sell their crypto in the last quarter of 2025.
I'm not saying it should happen, but it definitely seems possible. Also, to add even more spice to the mix. Time@mode methodology points in the same direction. Indeed, invalidations are expected and turbulent flows will be the norm, but this looks juicier than ever.
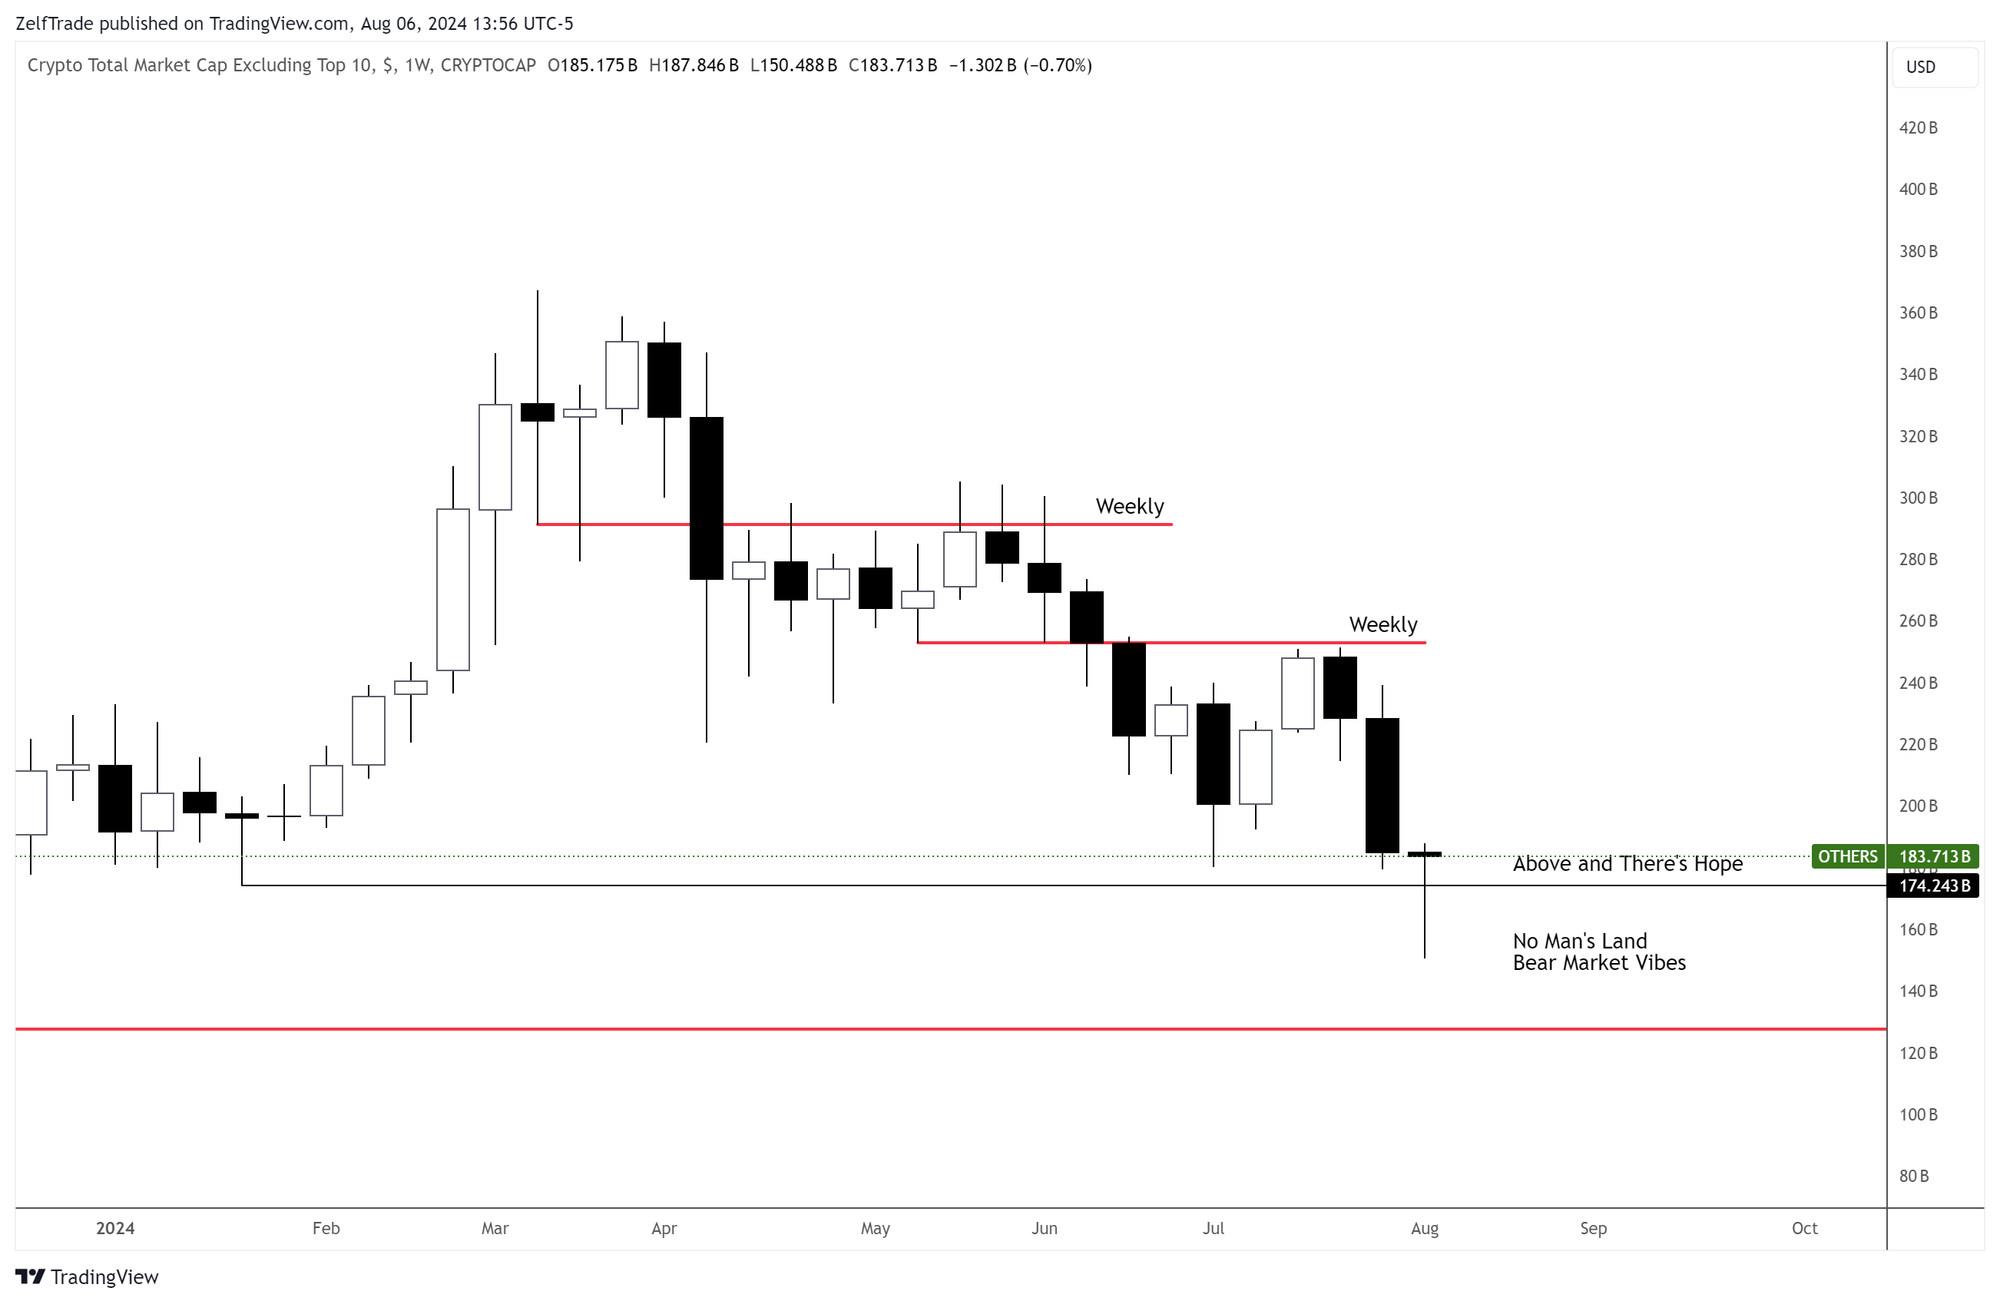
Let's move on to OTHERS
Top 100 currencies without the top 15, especially without stable currencies that just add dead weight to the index.
Positive Reaction at key level
- Forming a big liquidity grab from the last oscillating low and most pivotal point of this current move.
- Slowly moving away from "no man's land" with a good chance to close above this week.
- The daily chart is currently above the safety zone and a change in character will occur if $200 billion is regained (on the daily).
The chart looks very good from a technical perspective, it is only a matter of time before the uptrend confirms.
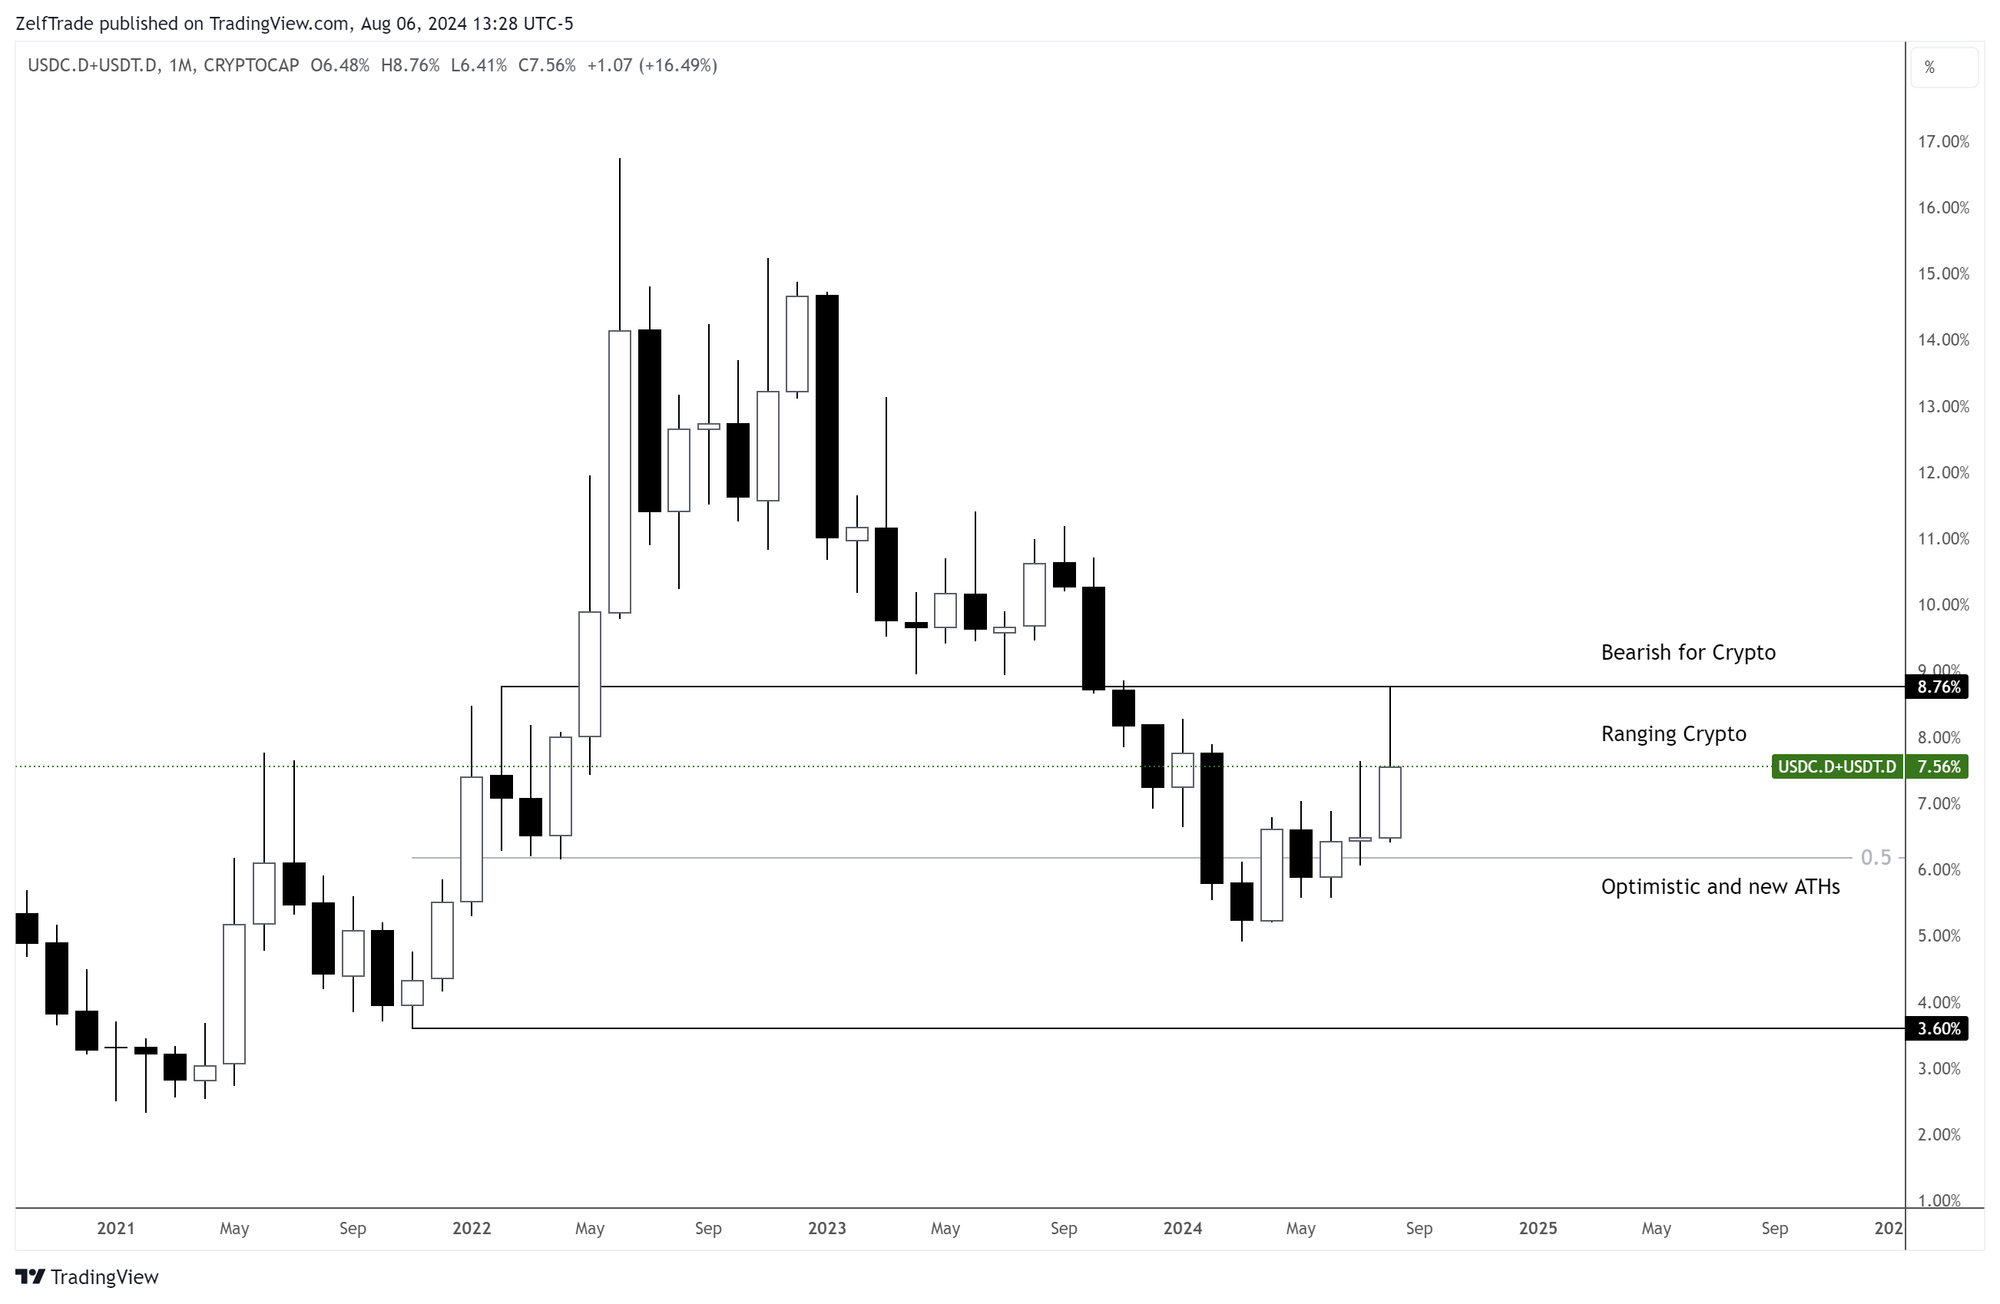
Stables Dominance
This chart shows the size of the major stable coins (USDC+USDT) relative to the total cryptocurrency market cap and is now ready to roll from here.
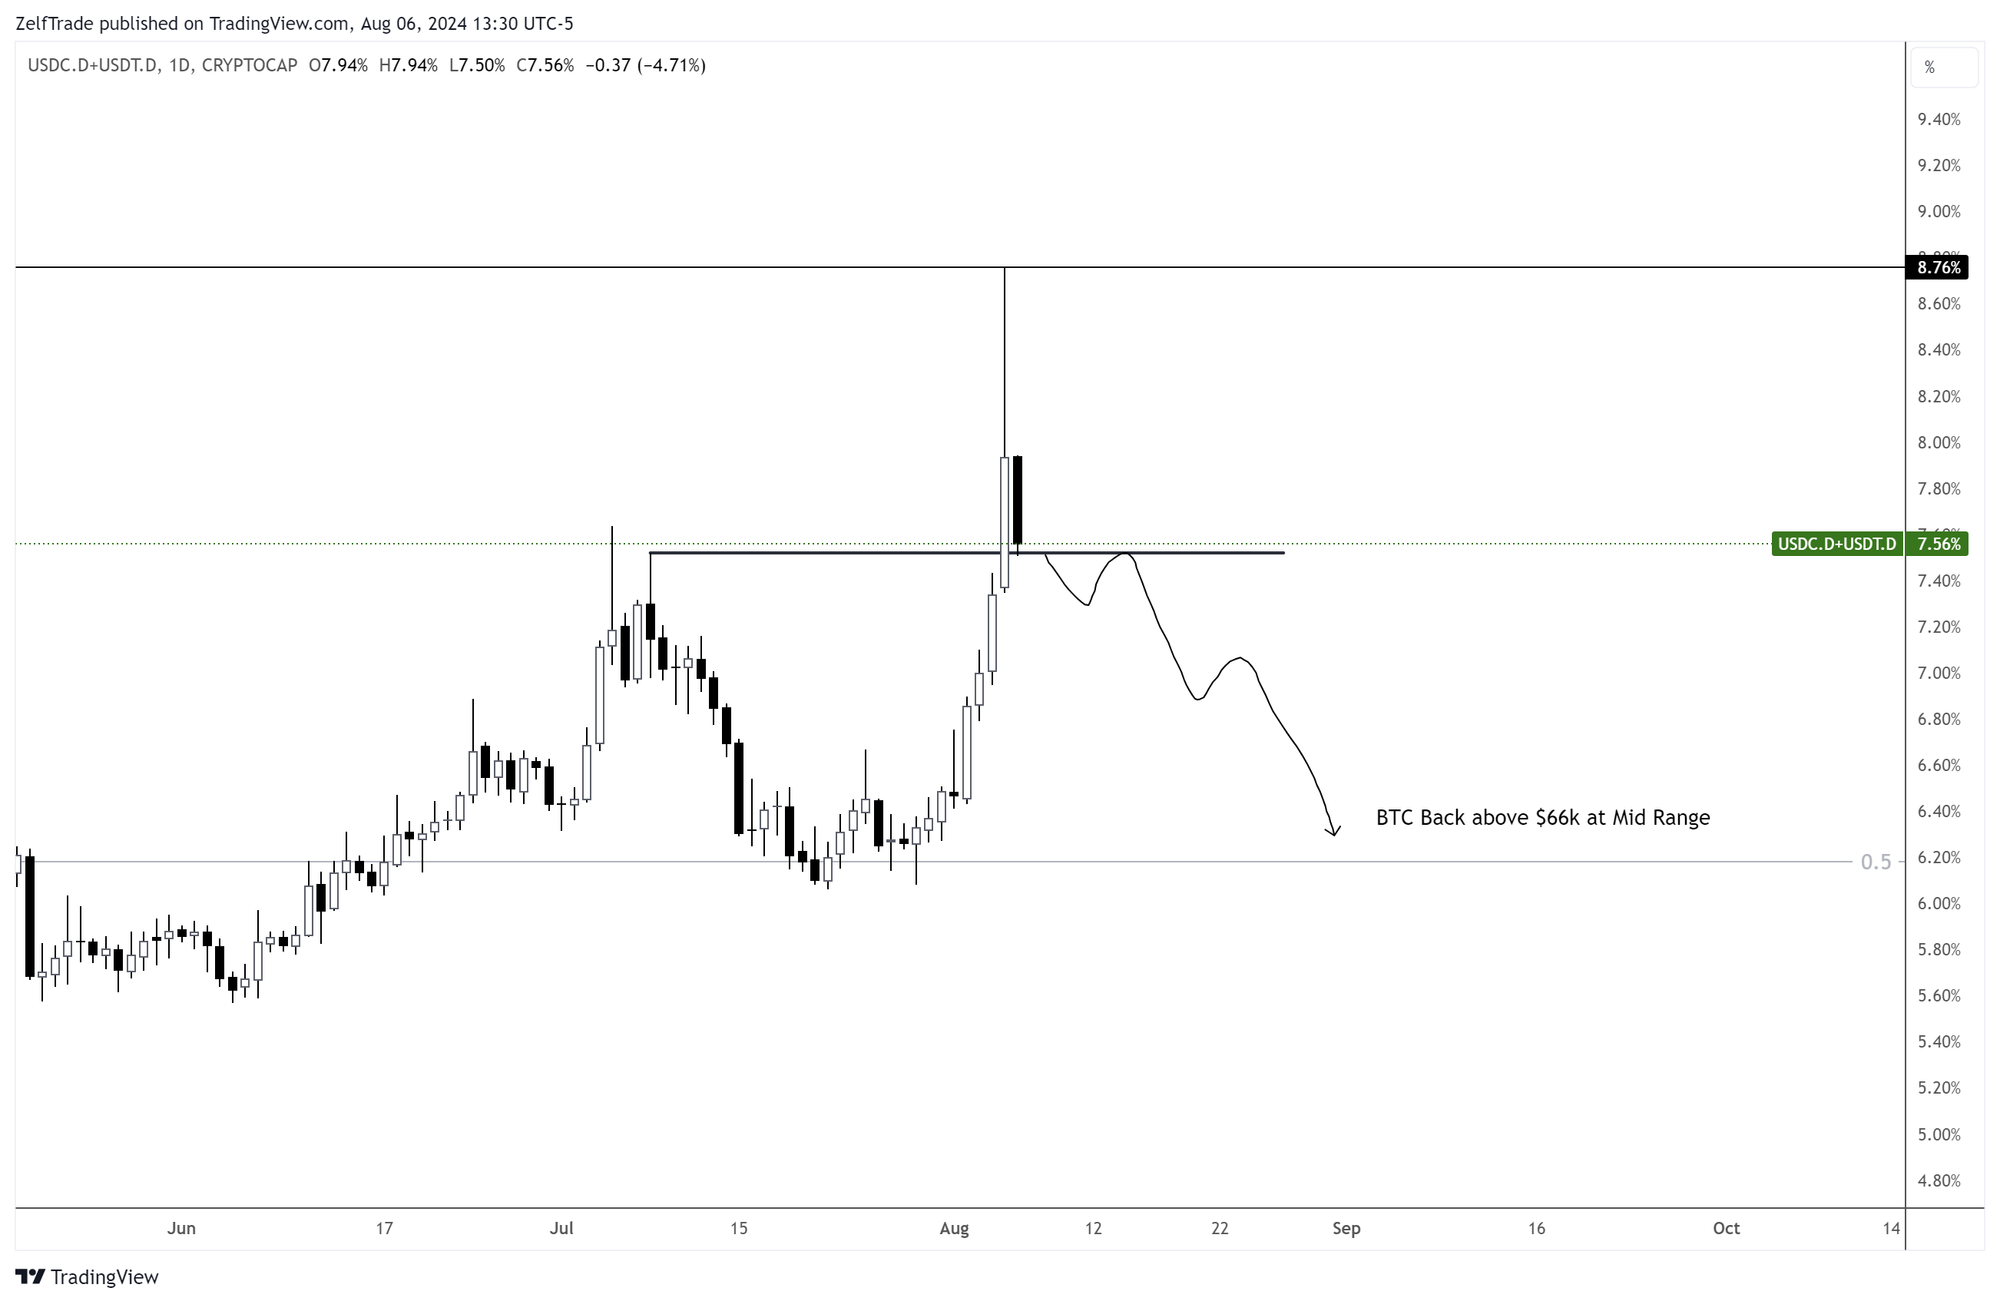
Used as a proxy for the amount of dry powder on the sidelines versus deployed in the market, this is marking a bottom, for now.
Perfect Retest of Resistance = Bullish for Crypto
Many of the market participants have been sitting on the sidelines in stables since March '24, causing this big momentum to hit resistance directly. It doesn't hurt to point out that most of this upside move was driven by weakness in altcoins.
Price forecast - Time to return to the market
That's it for now, having some nice correlations on a couple of patterns and market cap charts to help us understand the chances of a market bottom.
Better to start leaning more to the bullish side. I can't find a better time to do this as most altcoins have reached quarterly and yearly levels. I advise using your spare cash and buying back into your favorite coins, but especially the stronger ones like Solana. The trend has not yet been confirmed, but the price action and time consolidation are giving signs of a bottom in the market.
Disclaimer: This content was originally published on Zelf Trade.