Back to Trade Signals




market-updatetrading-signal
Is the Market Topping or Just Pausing? Analyzing Bitcoin's Current Position
Is the Market Topping or Just Pausing? Analyzing Bitcoin's Current Position - Read the full update on Zelf Trade.
Samuel Castellanos•
Is the Market Topping or Just Pausing? Analyzing Bitcoin's Current Position
A lot of people are starting to wonder if the market has reached its peak, or at least if we're in the midst of a serious pause. Bitcoin hit a local top at $107k, but there's been a noticeable lack of follow-through since then. The big question now is whether the market has topped out or if there's still a chance for a continuation. Alternatively, could we see another pullback into what I consider the must-defend zone to keep the market healthy?
Before diving into the charts, let's take a step back and discuss a crucial point I always emphasize: Risk management. If you're trading anything other than Bitcoin, keep in mind that Bitcoin has historically outperformed every other coin in the long term since its launch. Ethereum and Litecoin are two clear examples of this. So, always keep an eye on how your favorite altcoins are performing against BTC.
A quick tip: Think in terms of sats (satoshis), not USDT. If you could only trade against BTC pairs, would you still invest in your altcoin? That simple thought experiment should answer most of your questions about long-term altcoin investments. Of course, short-term trading is a different story, and that's where this market remains highly speculative and full of risk—especially with new trends emerging.
Now, let’s get back to Bitcoin.
Is the Top In?
Let’s start by evaluating Bitcoin's broader macro movements. I know it's a huge timeframe, especially given Bitcoin’s relatively young history with only three major market cycles to study. But even with this limited data, it's enough to start analyzing the big picture.
The easiest conclusion is that Bitcoin is heading much higher—this much is clear. But when you dig deeper, we see some interesting patterns that are worth exploring.
Quarterly Overview
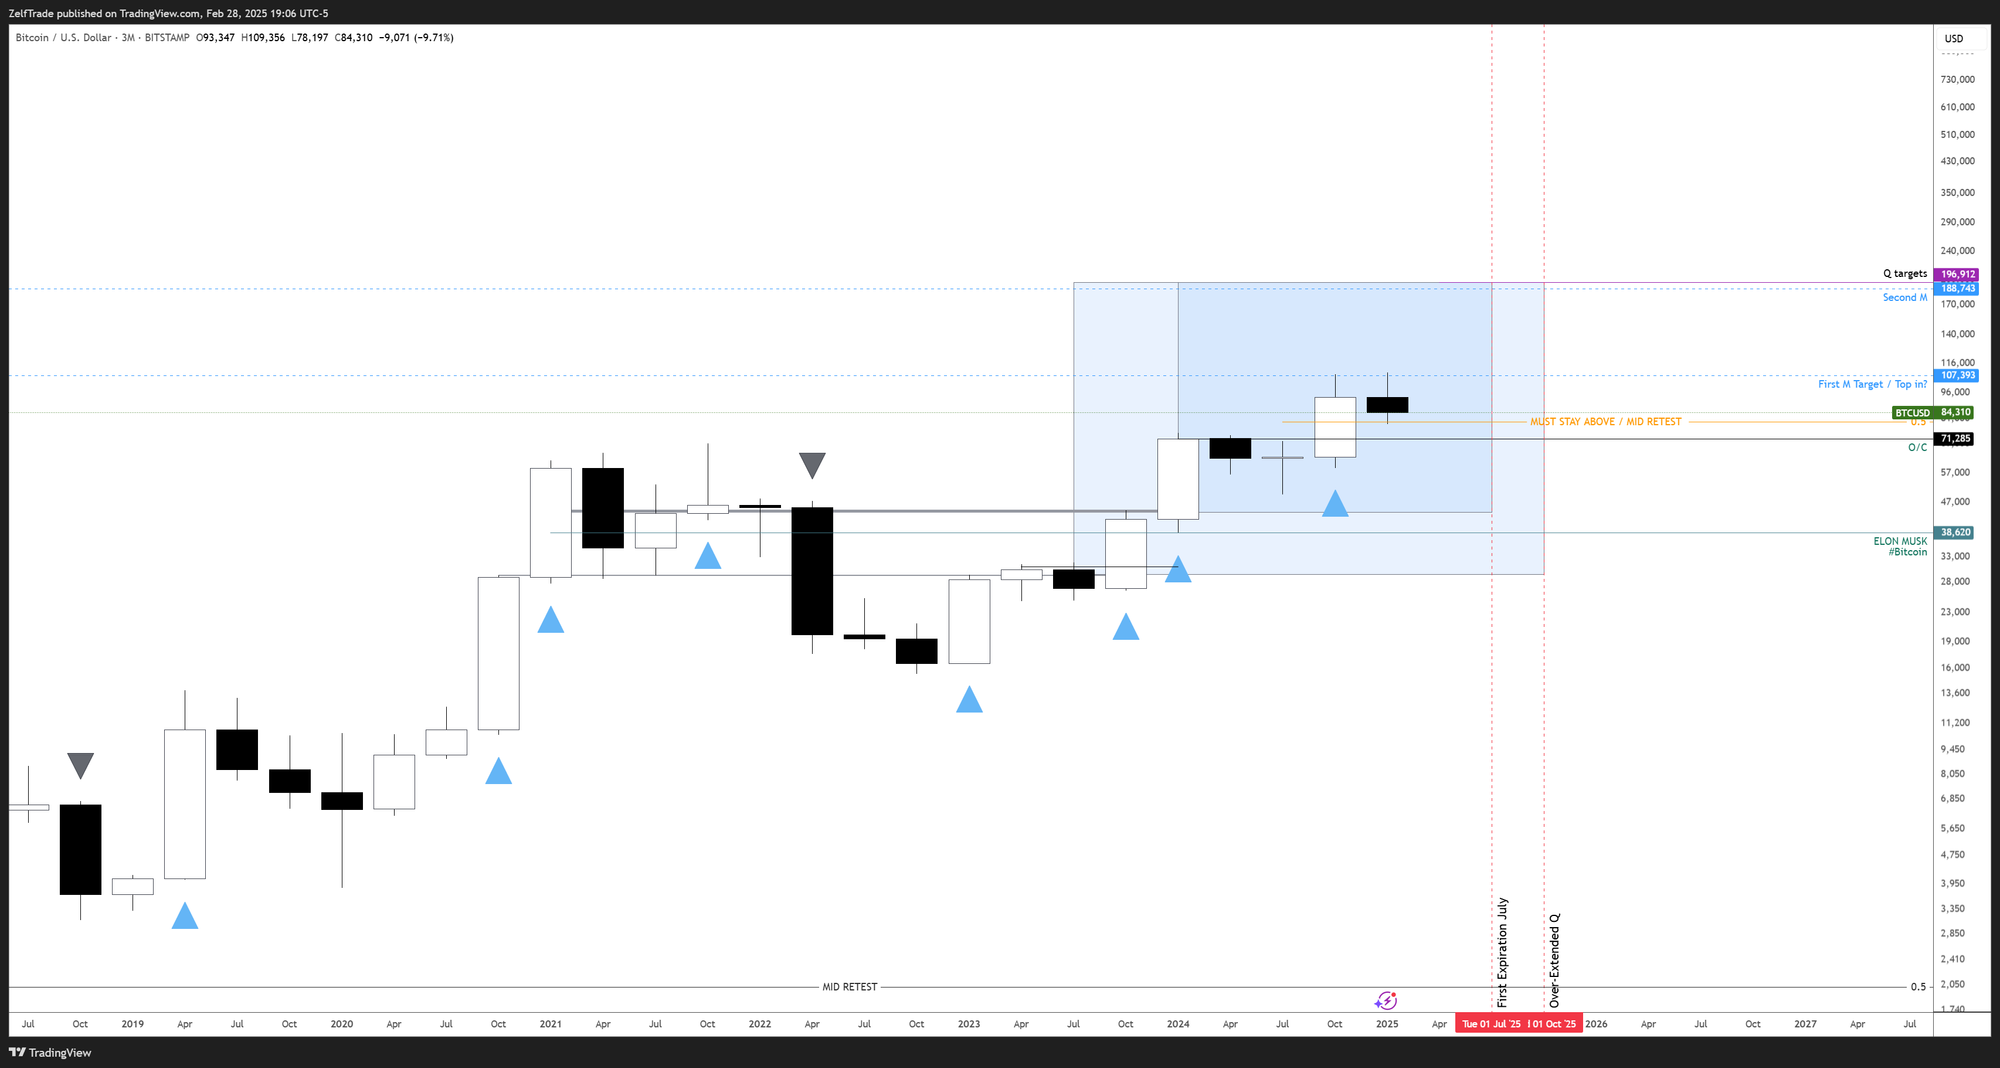
Comparing Bitcoin's current quarterly movement with previous cycles, the closest match is the 2015 run. While the percentages are completely different, the expansion bars resemble each other closely. So far, we've had five strong quarters, two behind the 2015-2017 run, which suggests that we’re in a similar pattern.
Take a look at the chart below, where we compare Bitcoin’s current movement to the 2015 expansion bars:
While this chart isn't a perfect match, it clearly shows that the trend remains intact. We’re currently testing the mid-level of the expansion bar around $78k, similar to what we saw throughout the 2015-2017 cycle. This could be a typical retest, and historically, these retests have led to continuation. So, while the trend is still active, that doesn't necessarily mean we’ll see exponential growth in the short term. The first expiration date for this trend is in July 2025, which gives us some time to observe how things develop.
The current quarterly signal is active and set to expire in July 2025, with the potential for an extended trend through the end of this year.
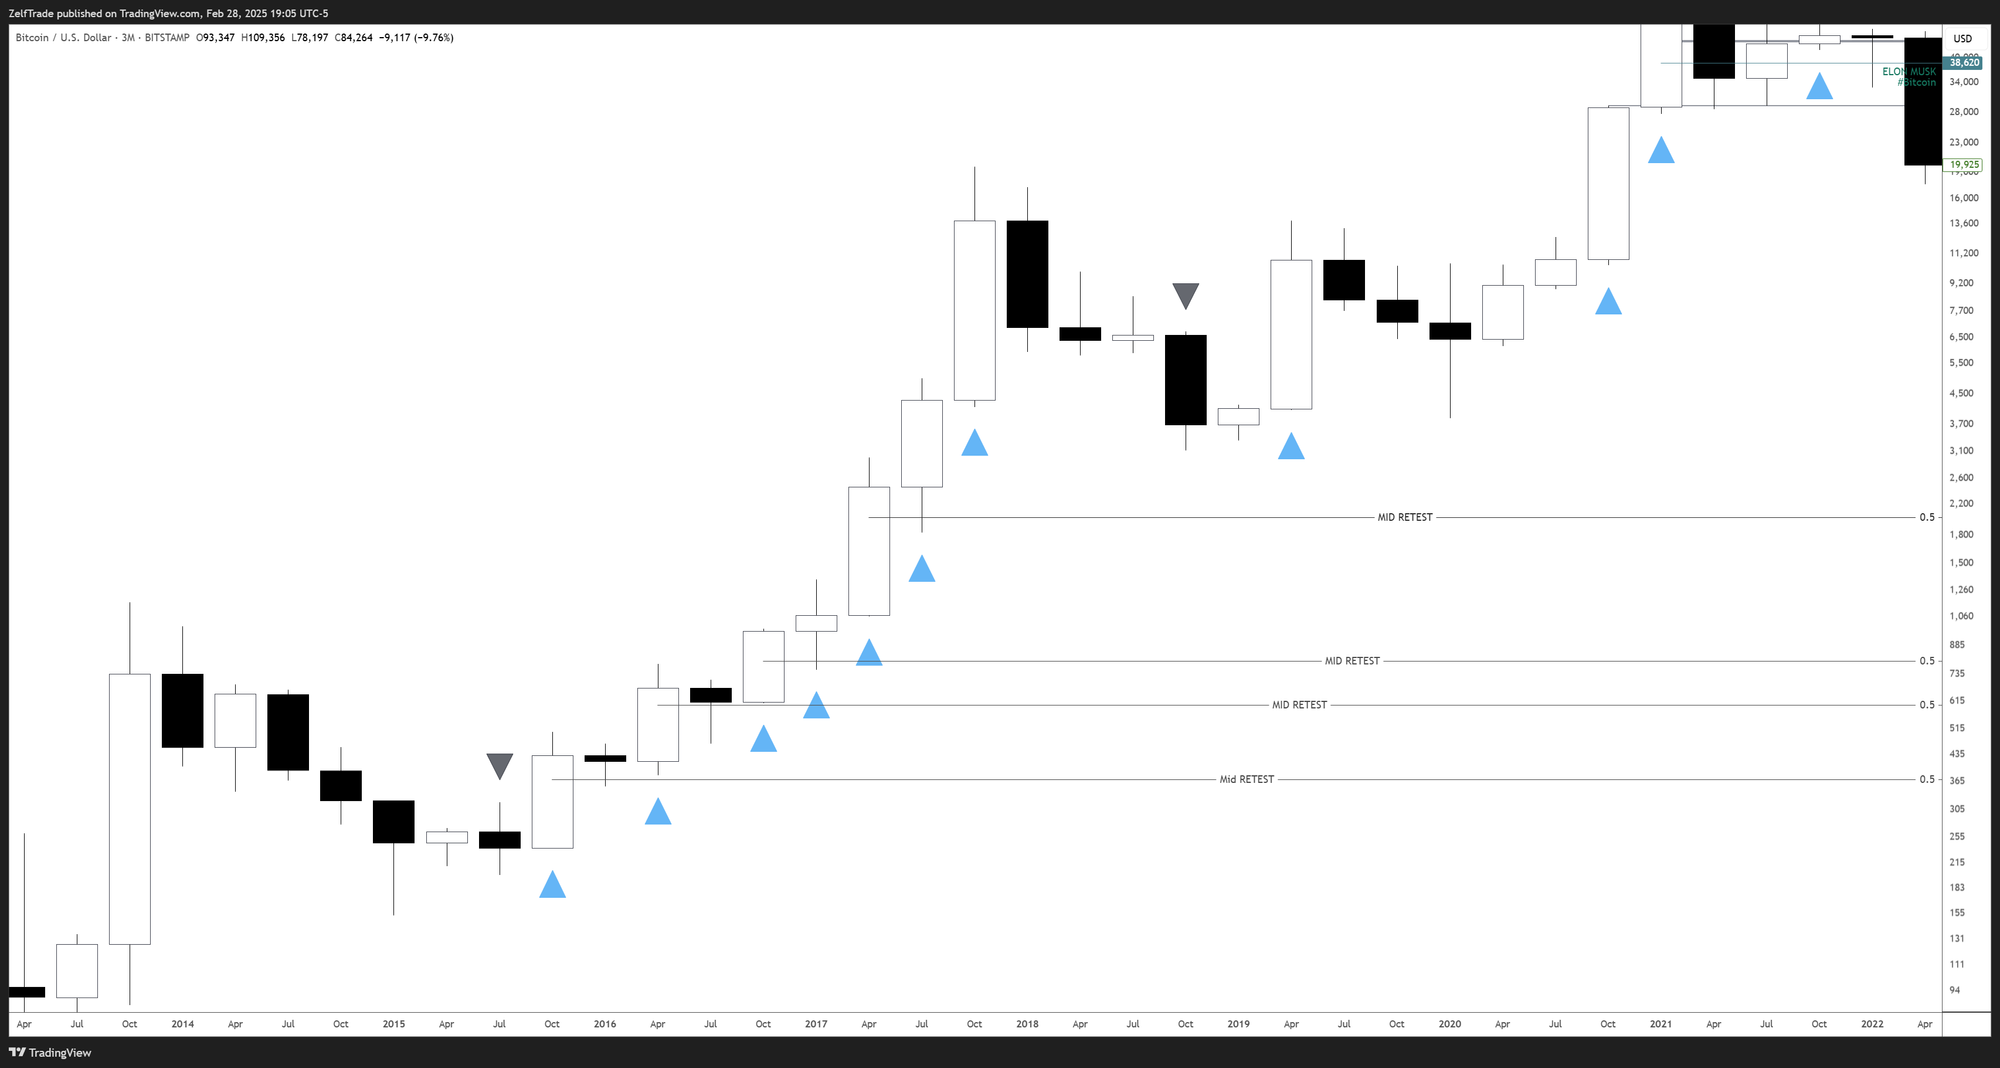
Below, you can take a look at the previous cycle and see how often the mid-levels were tested before continuing higher. Every single time, after a retest, new highs were made. Yes, the market was much smaller back then, but it still offers an interesting perspective on where we might be headed.
Monthly View
Looking at the monthly chart, things aren’t looking as clean. After tapping the first target in the monthly Time@mode ($107k), Bitcoin printed a bearish expansion bar, which is concerning. The market’s reaction to this level could signal a pullback, and I’m not overly bullish on a massive run-up from here.
However, it's not all bad news. The trend is still active, with the expiration date for this cycle set for July. The monthly structure would remain intact as long as the $53k-$72k range holds. In fact, in previous cycles (August 2014 and May 2022 bars), a similar setup only confirmed a downtrend in rare instances. So, the probability of reaching $64k isn’t as high as many might think.
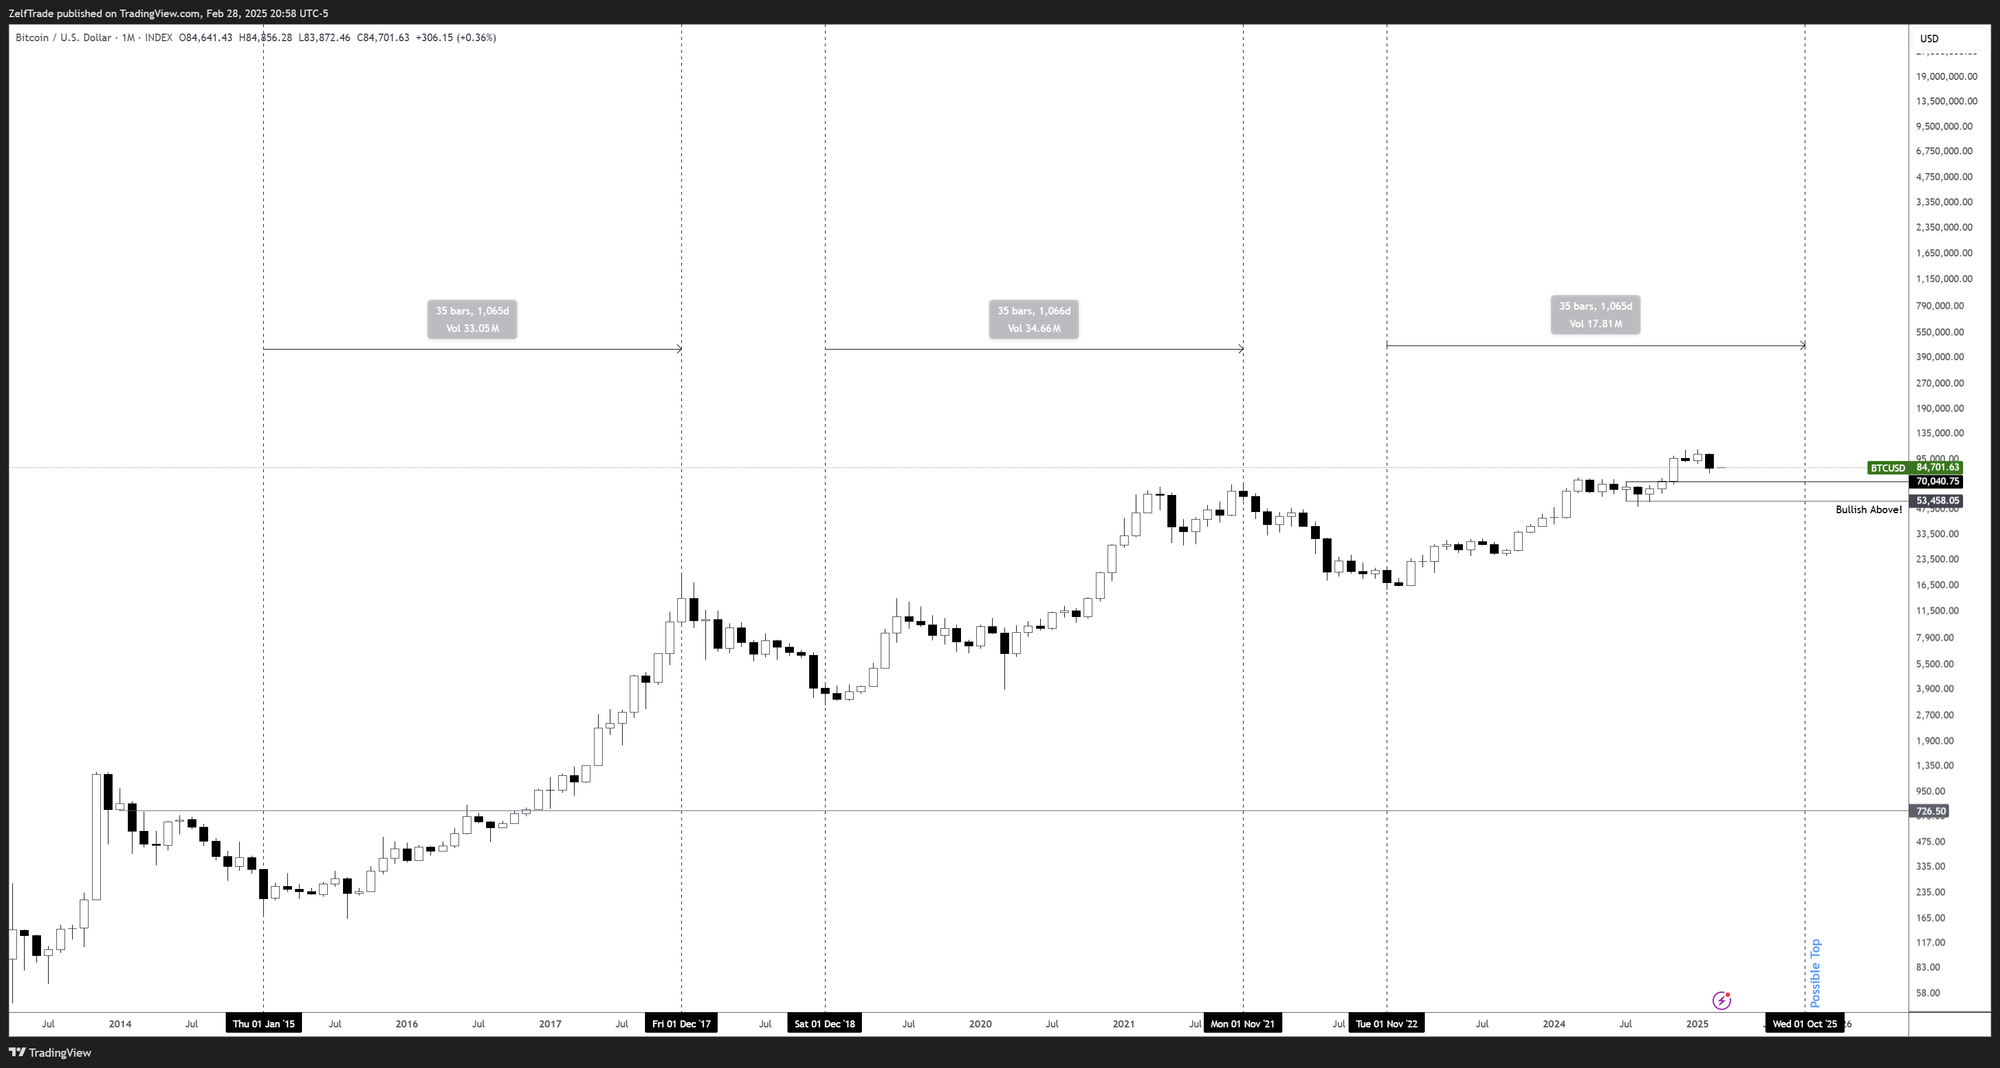
Here’s a quick look at the monthly chart:
So, there are both positive and negative signs. I’m leaning a bit more towards the positive side for now, as I don't think the top is here yet. But this is something I’ll continue to monitor closely. The market could change drastically in the coming weeks, and I’ll keep you updated.
This chart has been used quite often, as it shows the previous two cycles and how far we are from repeating the same pattern. I believe Bitcoin has a chance to enter a multi-year uptrend, but at a much slower pace compared to previous cycles
Weekly View
On the weekly timeframe, I decided to start buying back into Bitcoin below $80k due to the confluence of several factors. It wasn’t just a typical retracement level; we also had the CME gap, a key moving average, and a mid-level retracement all aligning at that zone.
Take a look at this chart for reference:
Despite these positive factors, I do believe I’m still early in calling the bottom. There’s a clear downtrend mode with an expiration date set for March 20th, so we’re still a long way from confirming the bottom. We’re also about a month away from the close of this quarter, which adds to the uncertainty.
Here’s another chart showing the current downtrend signal expiring on March 20th
Conclusion: What’s Next?
I expect a bounce from the current zone between $76k and $80k, especially with the daily candle we just saw on the close. But it’s too early to definitively call the top or the bottom. We still need another monthly signal to confirm either direction.
For now, I still believe Bitcoin has room to move higher, but it will likely happen at a slower pace. It’s becoming more difficult to predict the shorter-term moves, especially with timeframes below the weekly tf. So, we’ll need to be more agile and play the probabilities based on a longer horizon.
As for altcoins—well, you know the drill. The past couple of weeks have shown us that sticking to Bitcoin and top 10 altcoins is the safer play until the market gives clearer signs of continuation.
P.S.
I’ll be putting out a small article next week on the altcoin cycle. I think there’s still some light at the end of the tunnel if things play out well from here.
Disclaimer: This content was originally published on Zelf Trade.