Back to Trade Signals
 Zelf TradeLR Guizado

market-updatetrading-signal
Commodities - Update #20
Commodities - Update #20 - Read the full update on Zelf Trade.
LR Guizado•
Commodities - Update #20
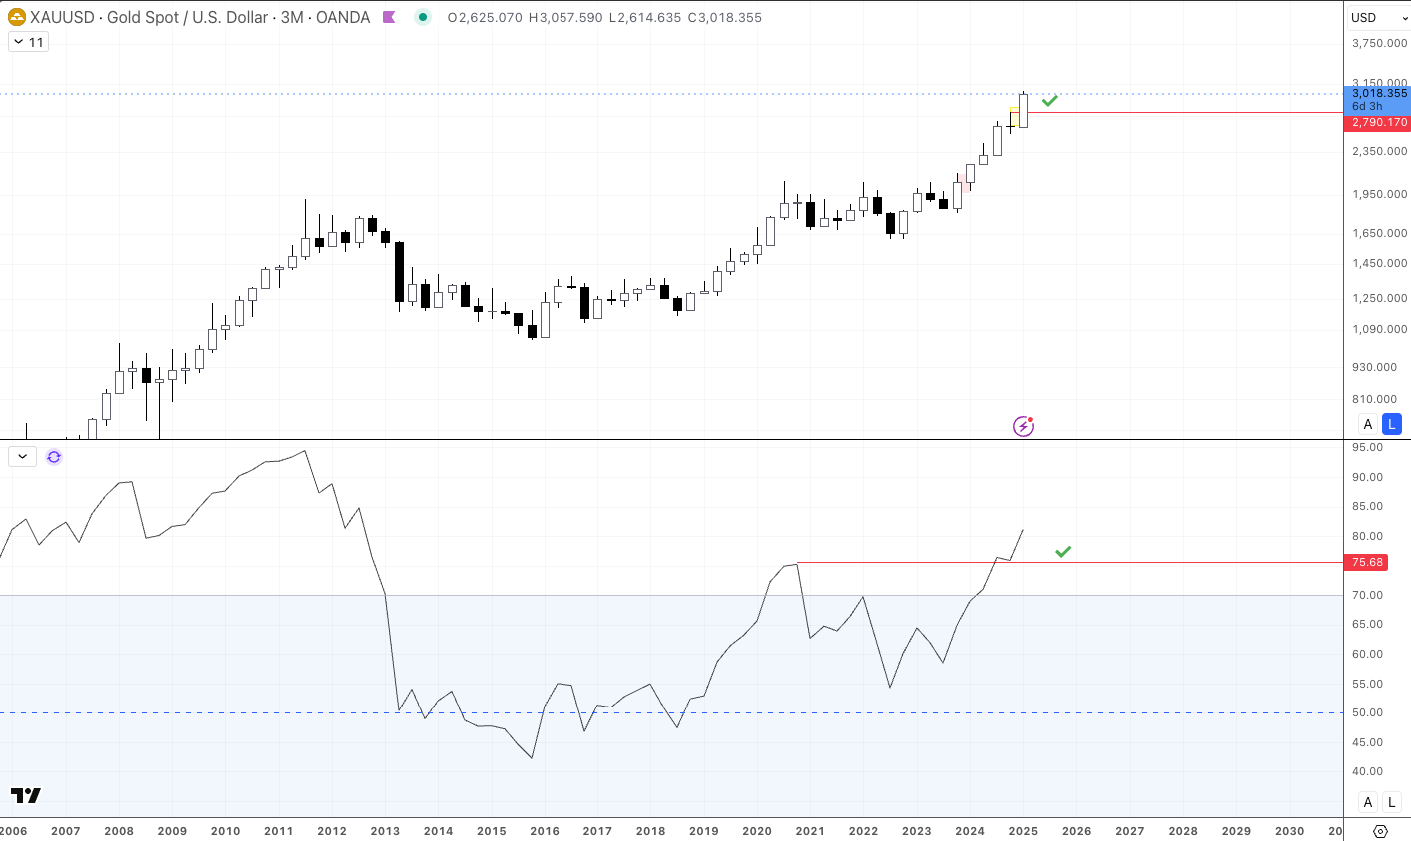
Gold (XAU) is flashing a major macro bullish signal as March is about to close with a 3M bullish engulfing candle which is a strong confirmation that bulls are firmly in control. Add to the equation: RSI holding firmly above 50 and making new higher highs in a clear bullish market structure. This sets the stage for continued upside momentum, reinforcing the higher-timeframe bullish trend. Remember: macro charts ALWAYS outweigh lower-timeframe noise, so while short-term pullbacks may happen, the big picture for gold remains overwhelmingly bullish.
3 month chart
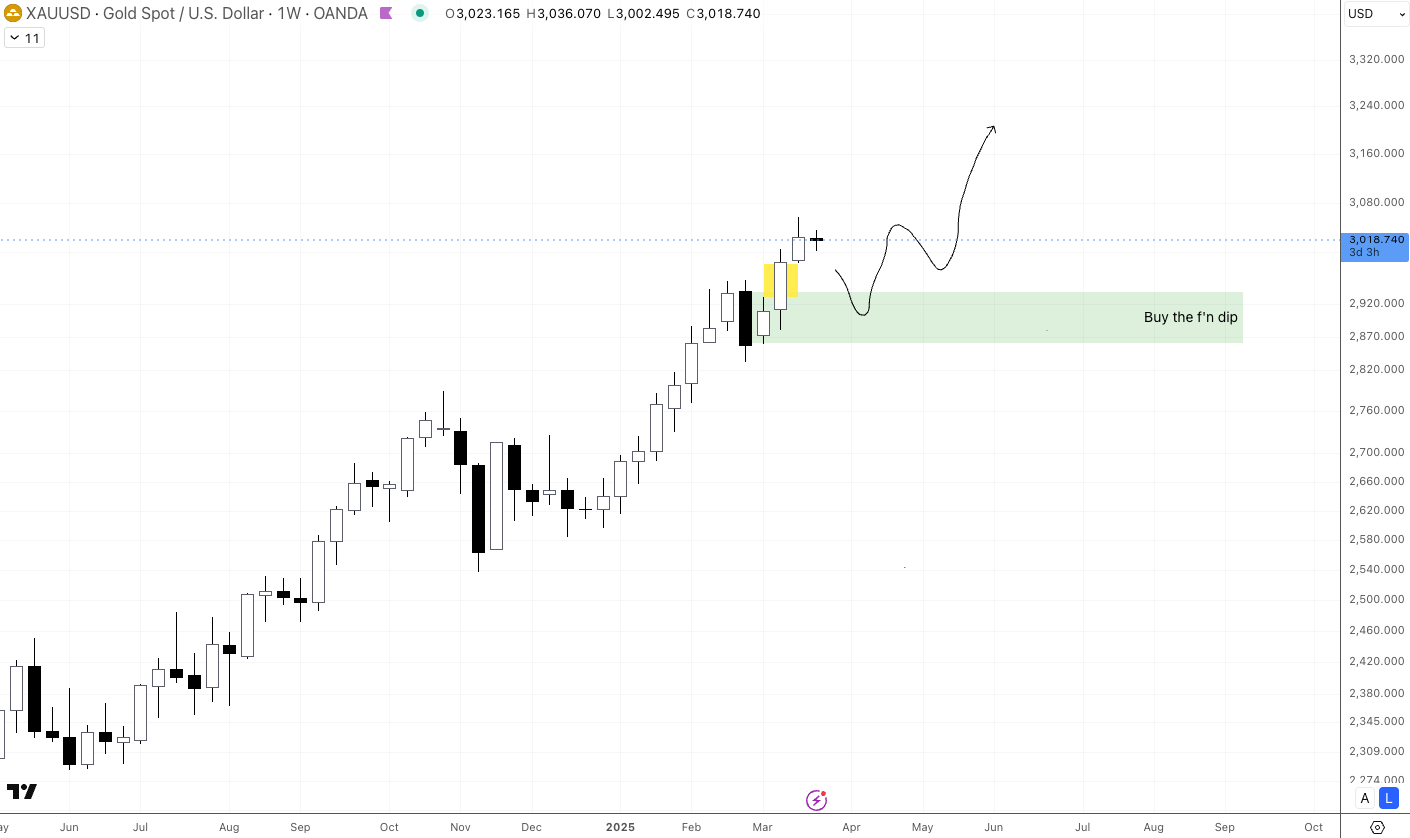
On the other hand, short-term weakness on the weekly and 2-week charts suggests a pullback might be on the horizon, this potential retrace actually presents the ideal risk/reward long entry opportunity, perfectly aligning with our expectation of a dead cat bounce in equities (as analyzed in our Mag7 tech stocks breakdown) before the next downward leg.
Weekly chart
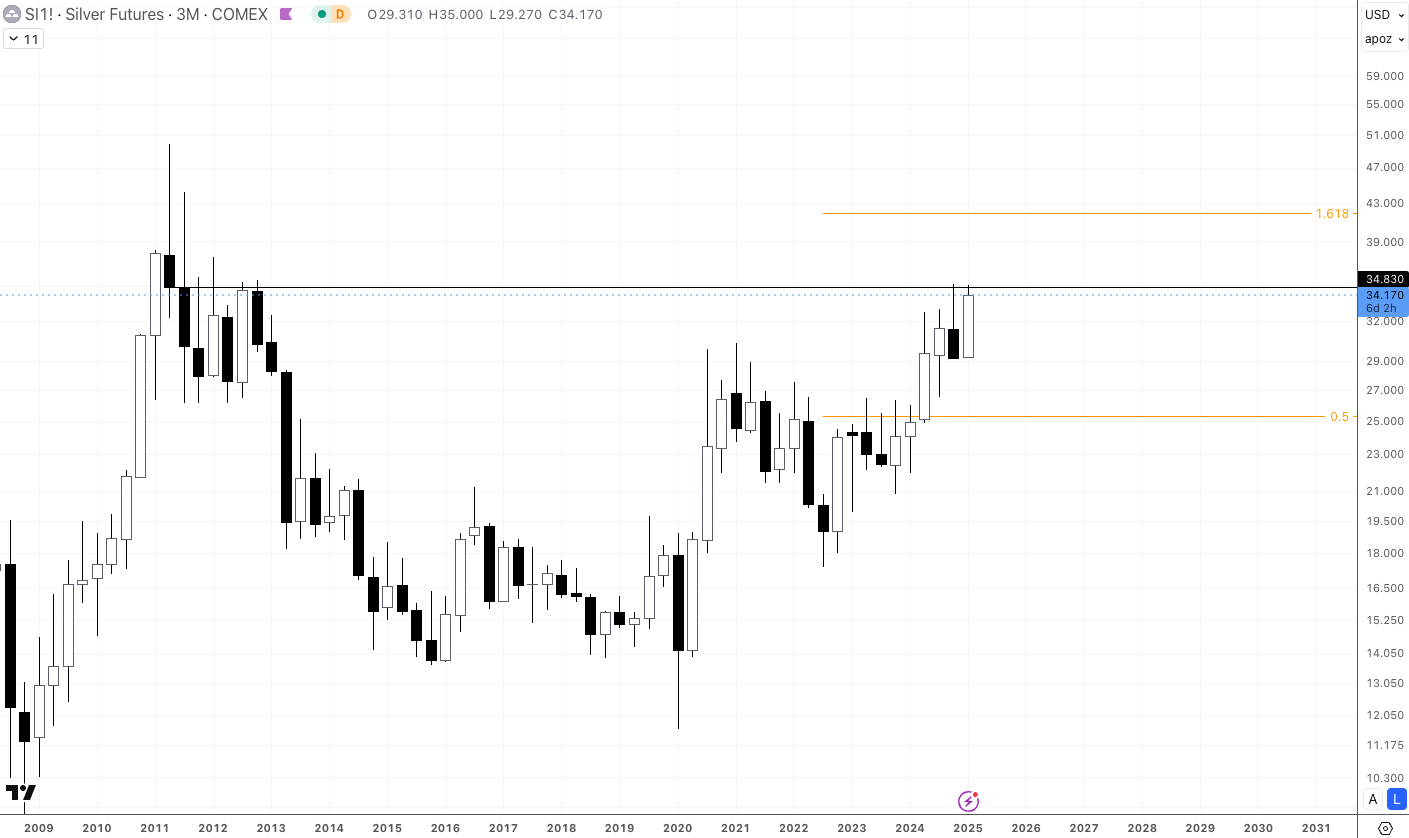
Silver (XAG/USD) shows a less convincing 3M chart compared to Gold's strong breakout, but the bullish potential remains intact. There is a clear resistance level at $35 that must be broken to confirm upside continuation. While Silver's higher timeframe structure lacks Gold's bullish conviction, its historical tendency to follow Gold's momentum suggests that a sustained rally in Gold could drag Silver higher.
3 month chart
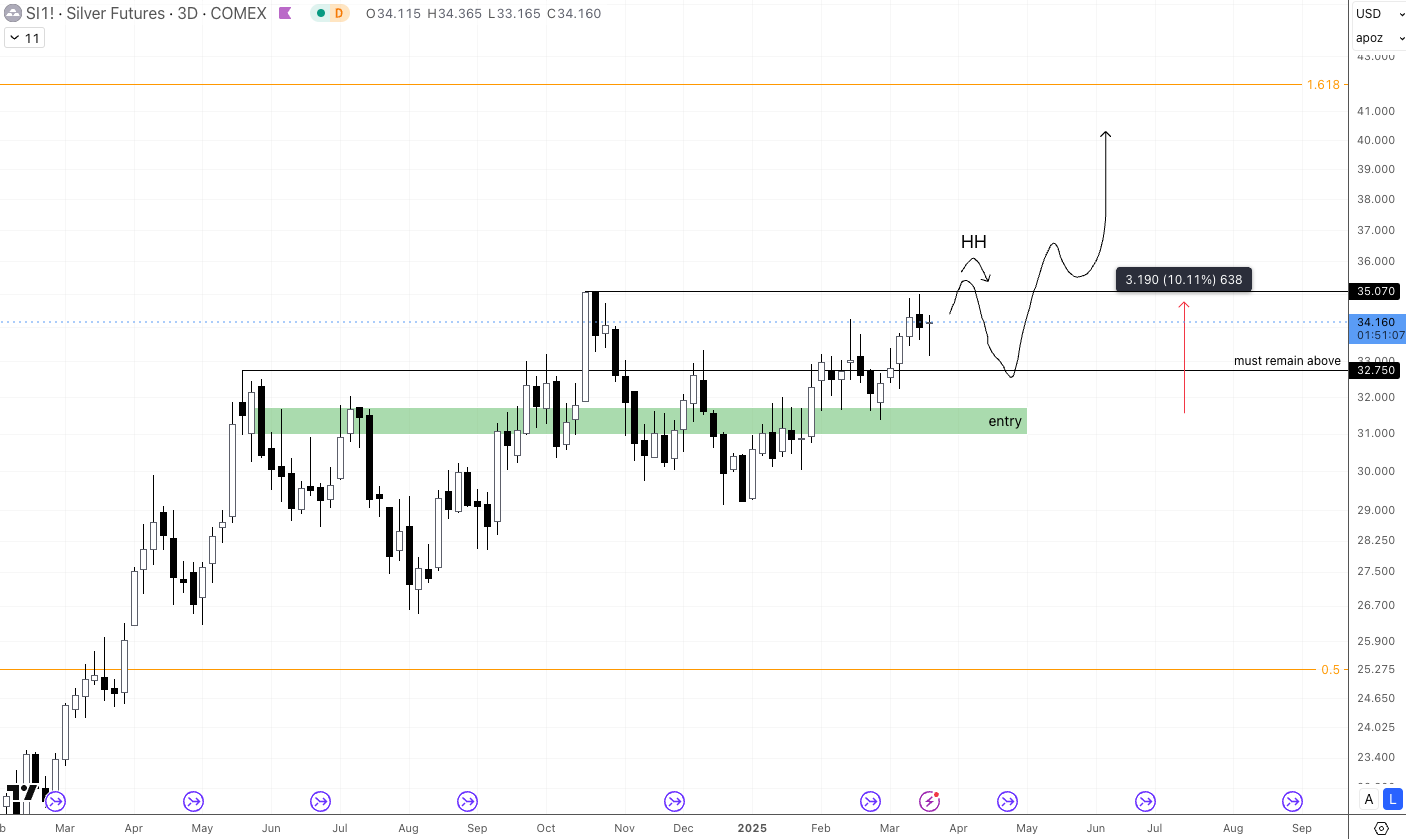
Our short-term silver long entry at $31 hit perfectly, and with price now reclaiming above $33+, we're sitting on a solid 8% gain – but for true confirmation of further upside, we need to see a decisive sweep of the previous $35.2 highs to validate the breakout and fuel the next leg higher. Ideally, I'd want to see the higher high print soon before any retrace. Here's how I see this playing out...
3 day chart
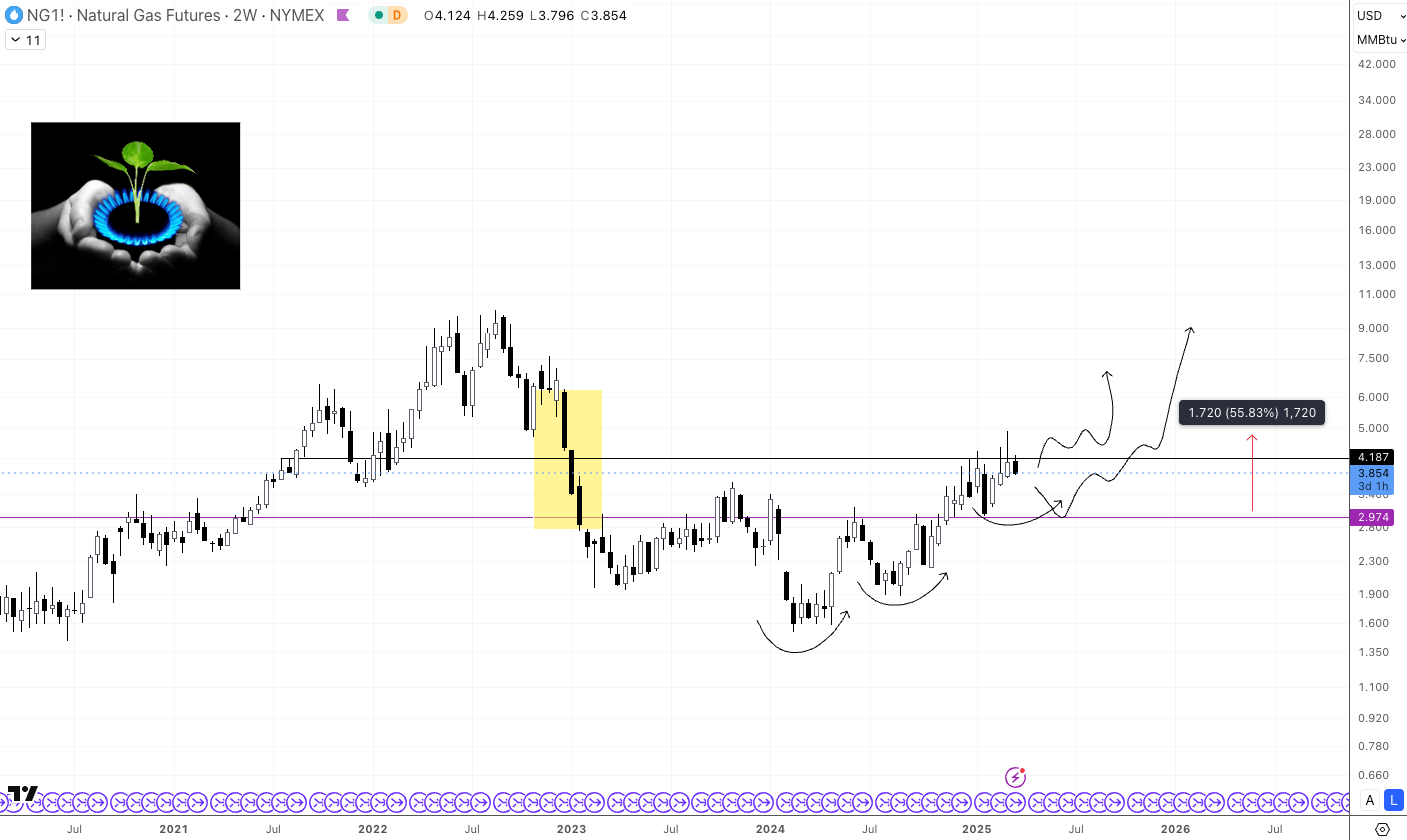
✅ Natural Gas (NG1!) Long Play Delivering Strong Gains
Our trade is performing exceptionally well, with prices surging +50% from our entry point—and the MACRO momentum isn't done yet. A clear fair value gap to the upside remains untapped, and historical price behavior suggests this could be filled within the next 2-3 months.
Our trade is performing exceptionally well, with prices surging +50% from our entry point—and the MACRO momentum isn't done yet. A clear fair value gap to the upside remains untapped, and historical price behavior suggests this could be filled within the next 2-3 months.
Now while the macro trend stays bullish, short-term volatility is expected. The two-week chart is now flashing signs of exhaustion, increasing the odds of a pullback before the next leg up. Partial profit-taking here is wise, and we need to see the $4.2 resistance decisively flipped to confirm bullish continuation. If price fails to break through, a short-term retrace is likely, offering a potential reload zone for the next push higher.
2 week chart
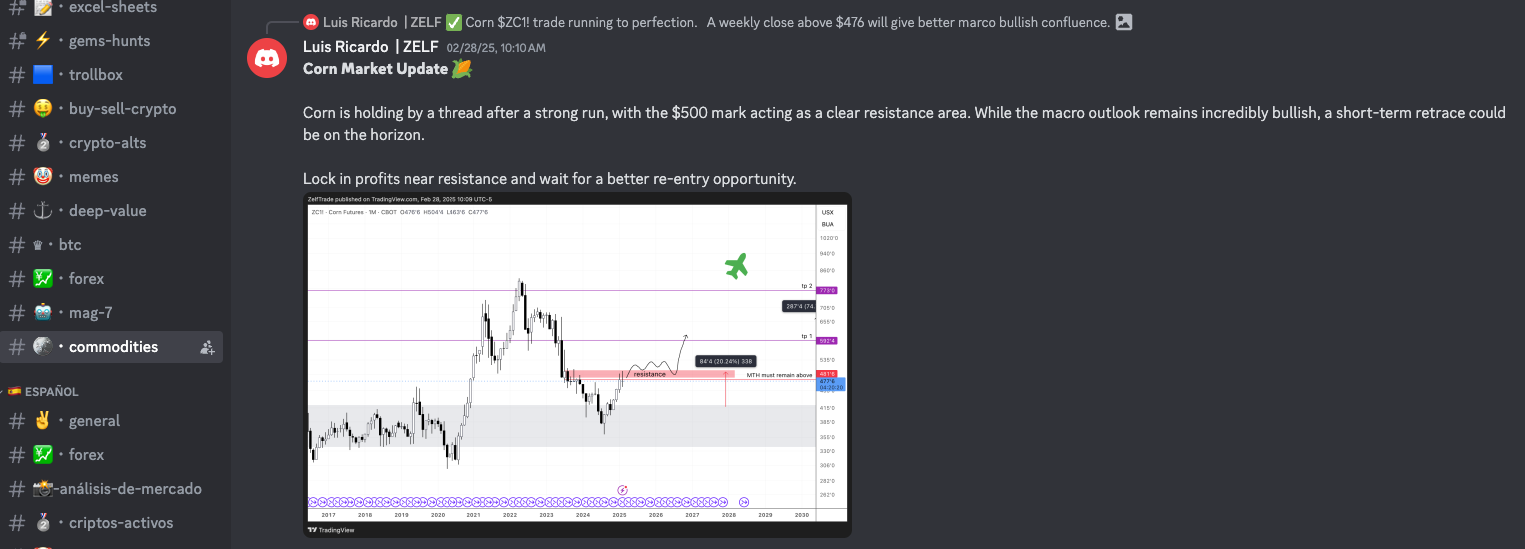
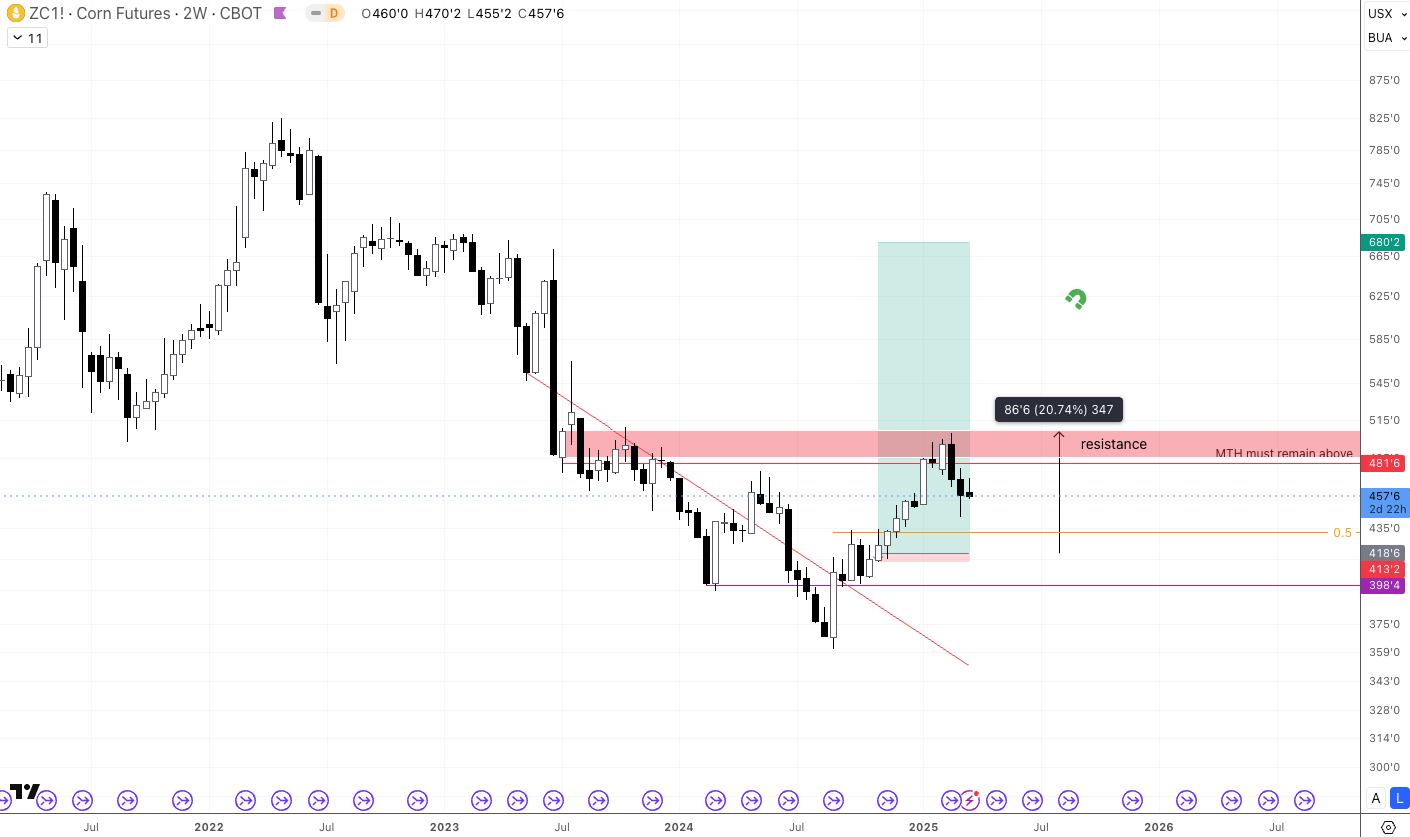
Corn (ZC1!) just as flagged in our Discord discussion, that key resistance level held firm and triggered a sharp rejection—hope you banked some of those +20% gains from the entry!
2 week chart
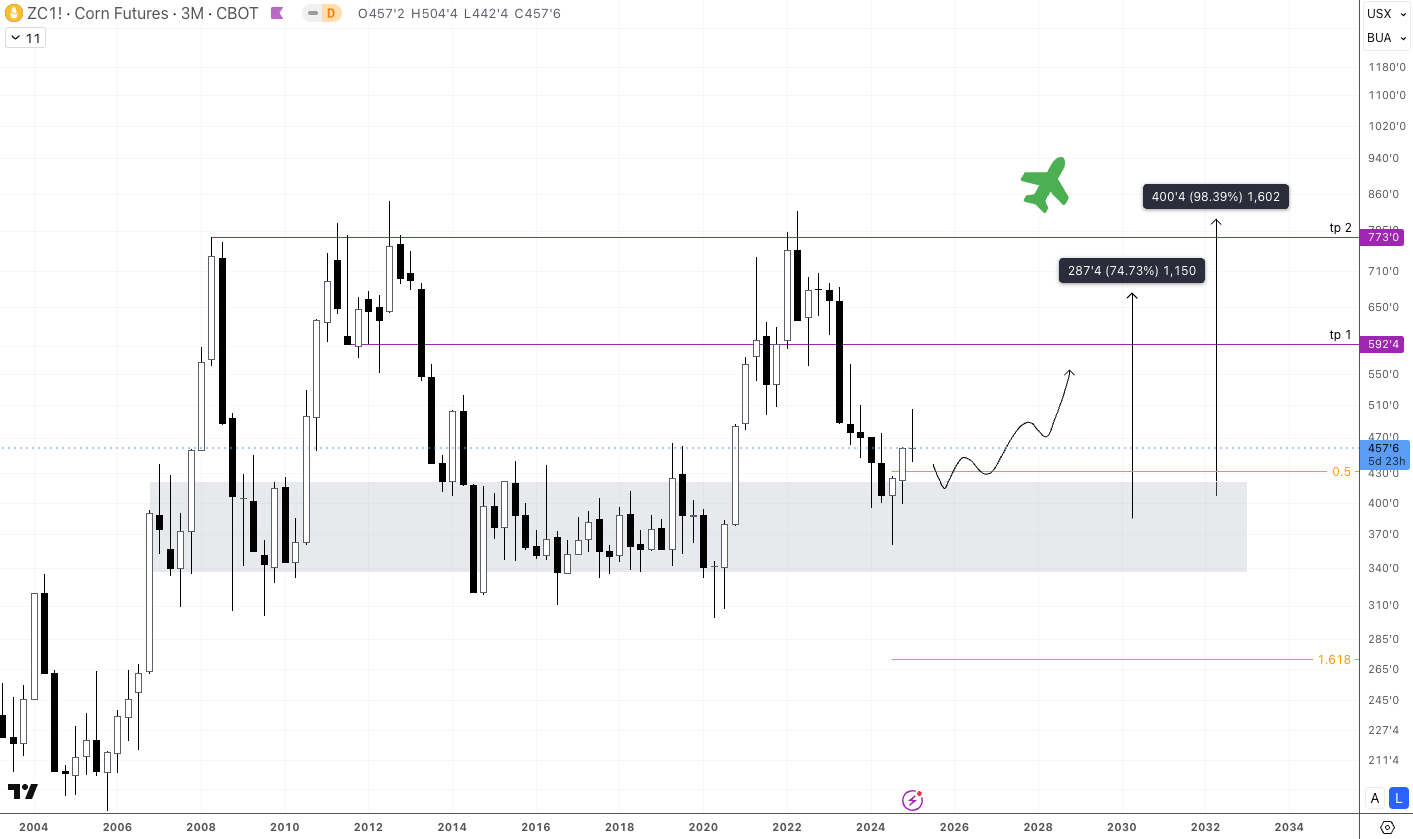
Now, with the pullback in play, the MACRO ideal re-entry zone stands at around $430, where we'll be watching closely for signs of a bounce to re-engage. Despite the strong bullish 3M engulfing candle on December, the 3M chart is about to close this month with a Doji, signaling potential short-term exhaustion. While the macro uptrend remains intact, this pause suggests we could see a pullback before the next leg up. The key? Don't fight the macro trend (BULLISH), but prepare for possible turbulence – tighten stops on longs and watch for opportunistic re-entries on dips.
3 month chart
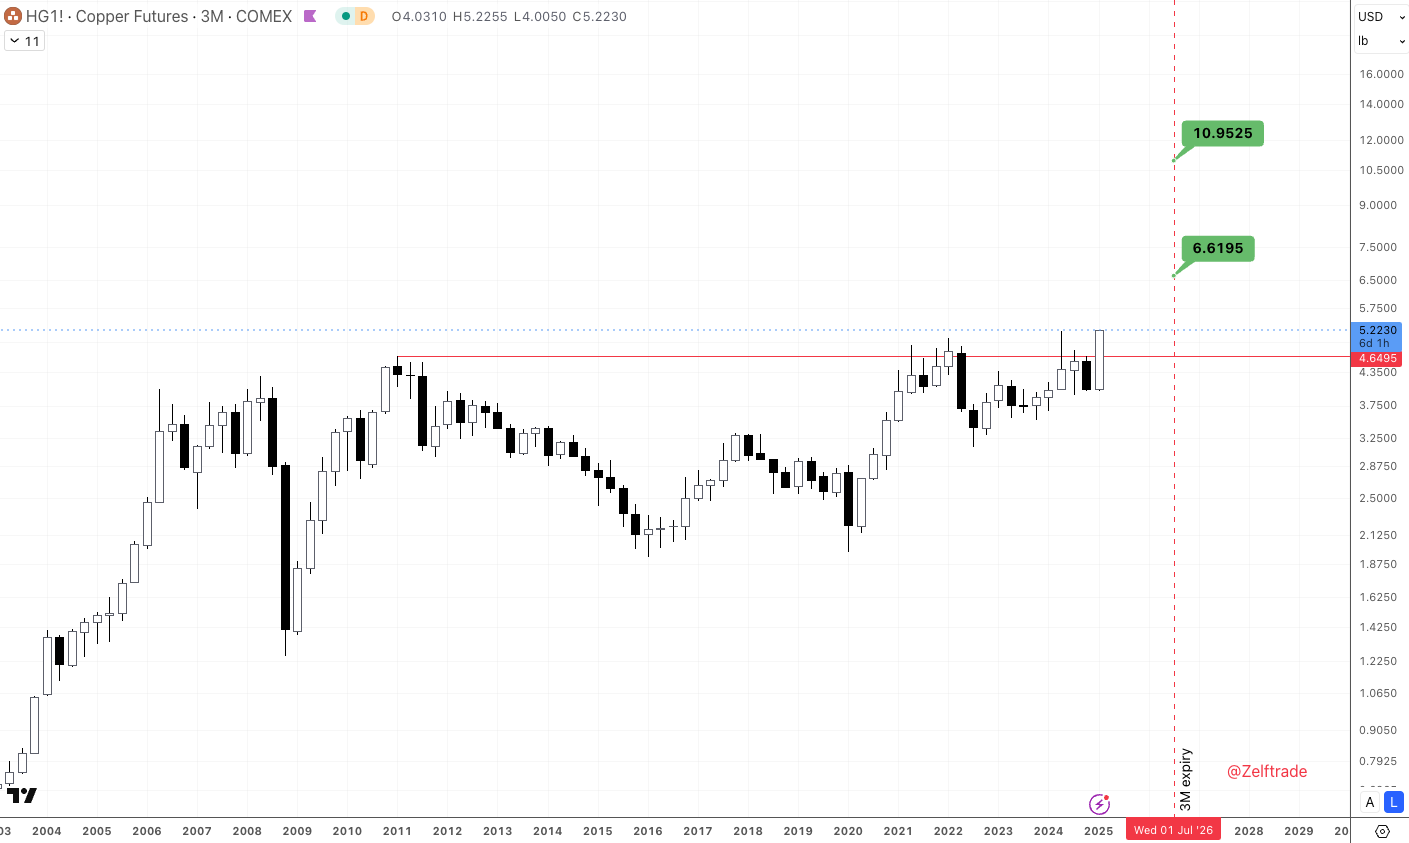
Copper (HG1!) is showing insane macro strength with a bullish engulfing candle on the 3M chart, confirming a major trend reversal and a Time at Mode bullish trend confirmation to the upside with targets of at least $7 and $11 by July 2026. While we'll wait for a pullback for optimal entry, the macro setup remains EXPLOSIVELY BULLISH, meaning any dips should be treated as high-conviction macro buying opportunities.
3 months chart
Previous Report HERE:
[
Commodities - Update 19
Shit’s going crazy in the stock market and metals have recovered bullish grounds. Will this be the beginning of metals bullish run? Bullish thesis confirmed on Gold $XAU as price just broke previous highs. Now there’s two scenarios: 1/ $2,750’s is the bottom. Pump from here. 2/ Price breaks
Zelf TradeLR GuizadoDisclaimer
Not financial or tax advice. Zelf Trade is not a financial institution. No content on this Newsletter is financial, accounting, legal or tax advice. Zelf Trade content is strictly educational and is not investment advice or a solicitation to buy or sell any assets or to make any financial decisions. This newsletter is not tax advice. Talk to your accountant. Do your own research.
Disclaimer: This content was originally published on Zelf Trade.