Back to Trade Signals
 Zelf TradeSamuel Castellanos
 Zelf TradeSamuel Castellanos

market-updatetrading-signal
Is It Time to Get Excited?
Is It Time to Get Excited? - Read the full update on Zelf Trade.
Samuel Castellanos•
Is It Time to Get Excited?
It’s been over a month since Bitcoin's significant drop in August, and things are finally beginning to settle. Market sentiment has shifted notably, and it "seems" we’re entering a bullish phase. But why the quotes around "seems"? In trading, nothing is ever certain. If you’ve been in the crypto game for over five years, you know we still need to confirm one crucial level: the higher low that will solidify this shift in market structure.
Looking back at my previous post, “The Dip of the Dippity Dip?”, it appears that was indeed the best buying opportunity. The actionable trades at $53k, $56k, and the final bid at $57k are still in profit as we await a valid confirmation signal on higher timeframes.
[
The Dip of the Dippity Dip?
What a drop and arguably the best buying opportunity this quarter. How much lower can it go? A question of fear and desire for lower prices that left many on the sidelines wondering if it was the right thing to do. Let’s try to be more rational, as there are
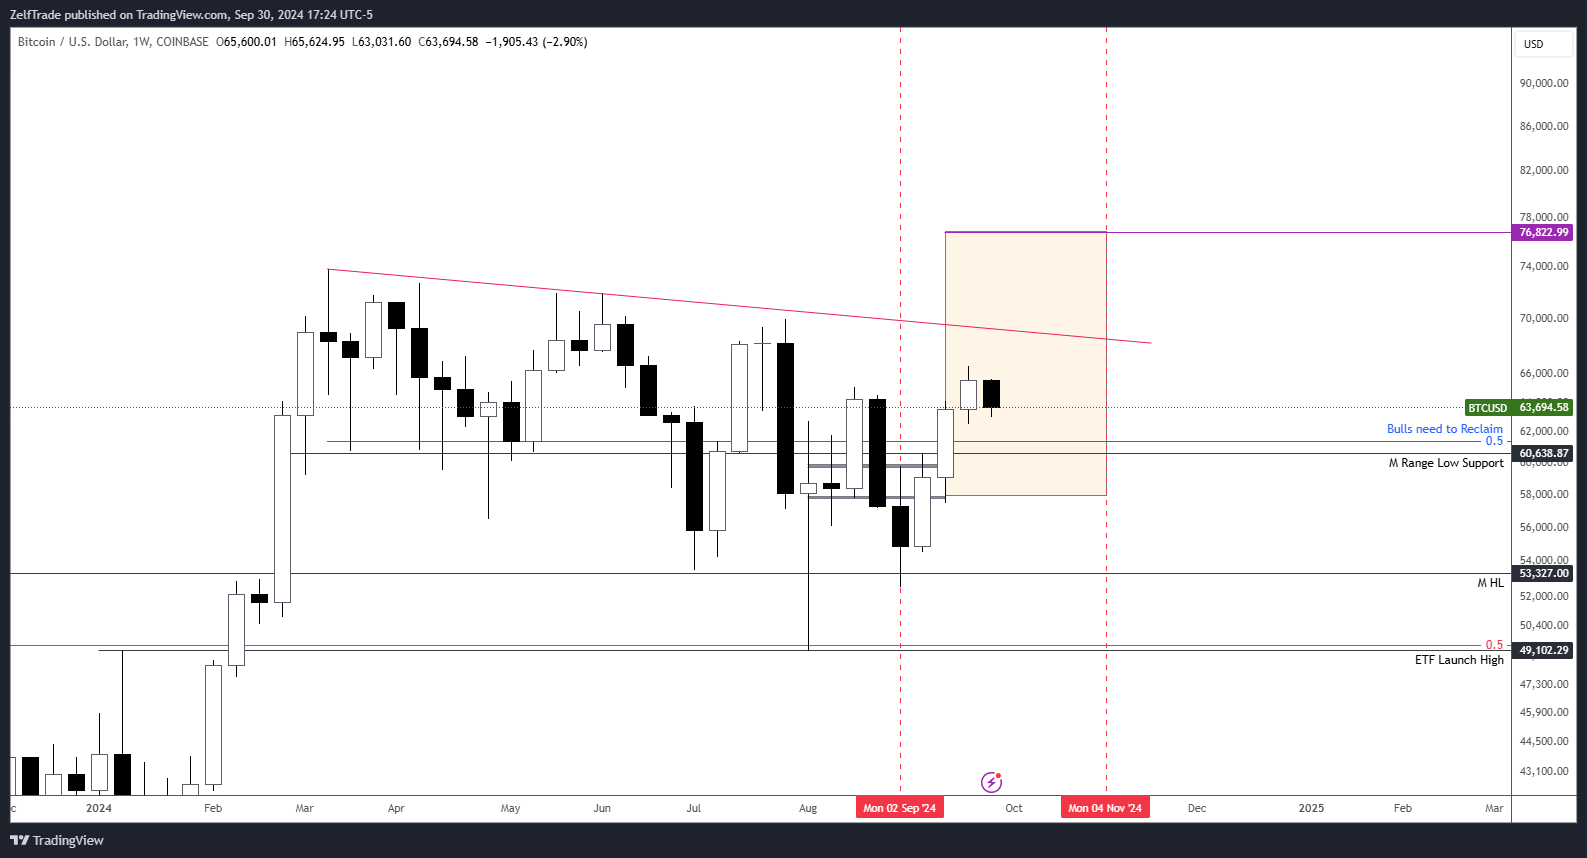
Zelf TradeSamuel CastellanosI’ve been steering clear of the daily chart (only using it to find buying opportunities), as it hasn’t provided much insight into market trends. So, let’s update the monthly chart and see if we can trigger new signals for Uptober and possibly Movember.
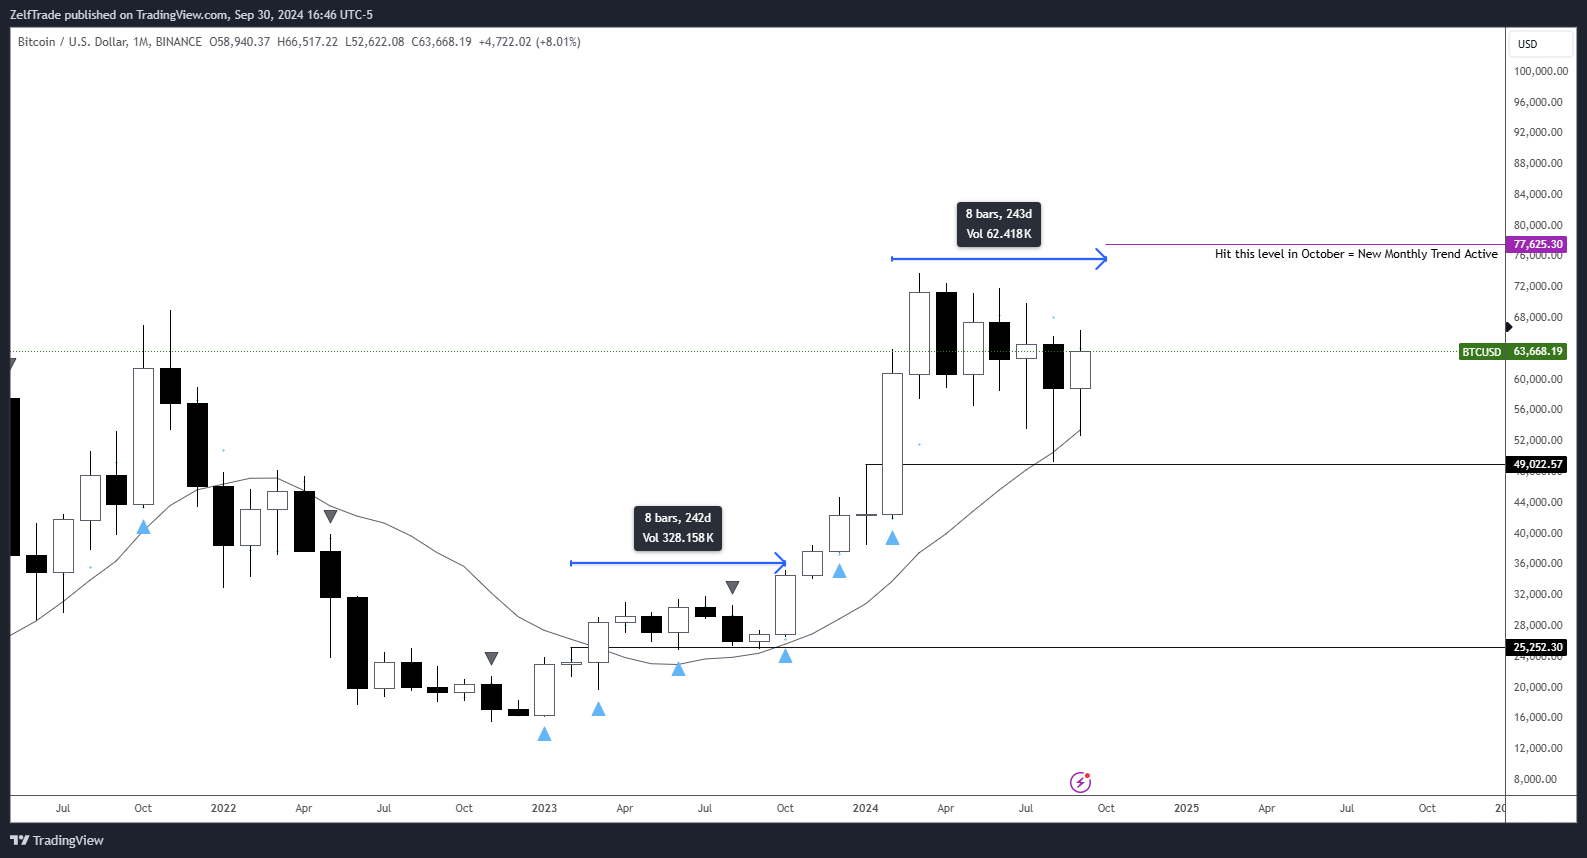
Monthly View
A bullish trend could ignite if we reach $77,625.3 by October. There’s a solid chance we could see a repeat of last year’s rally, with October serving as a catalyst for Bitcoin’s strongest move since the low of around $15.5k.
October's Trigger Price
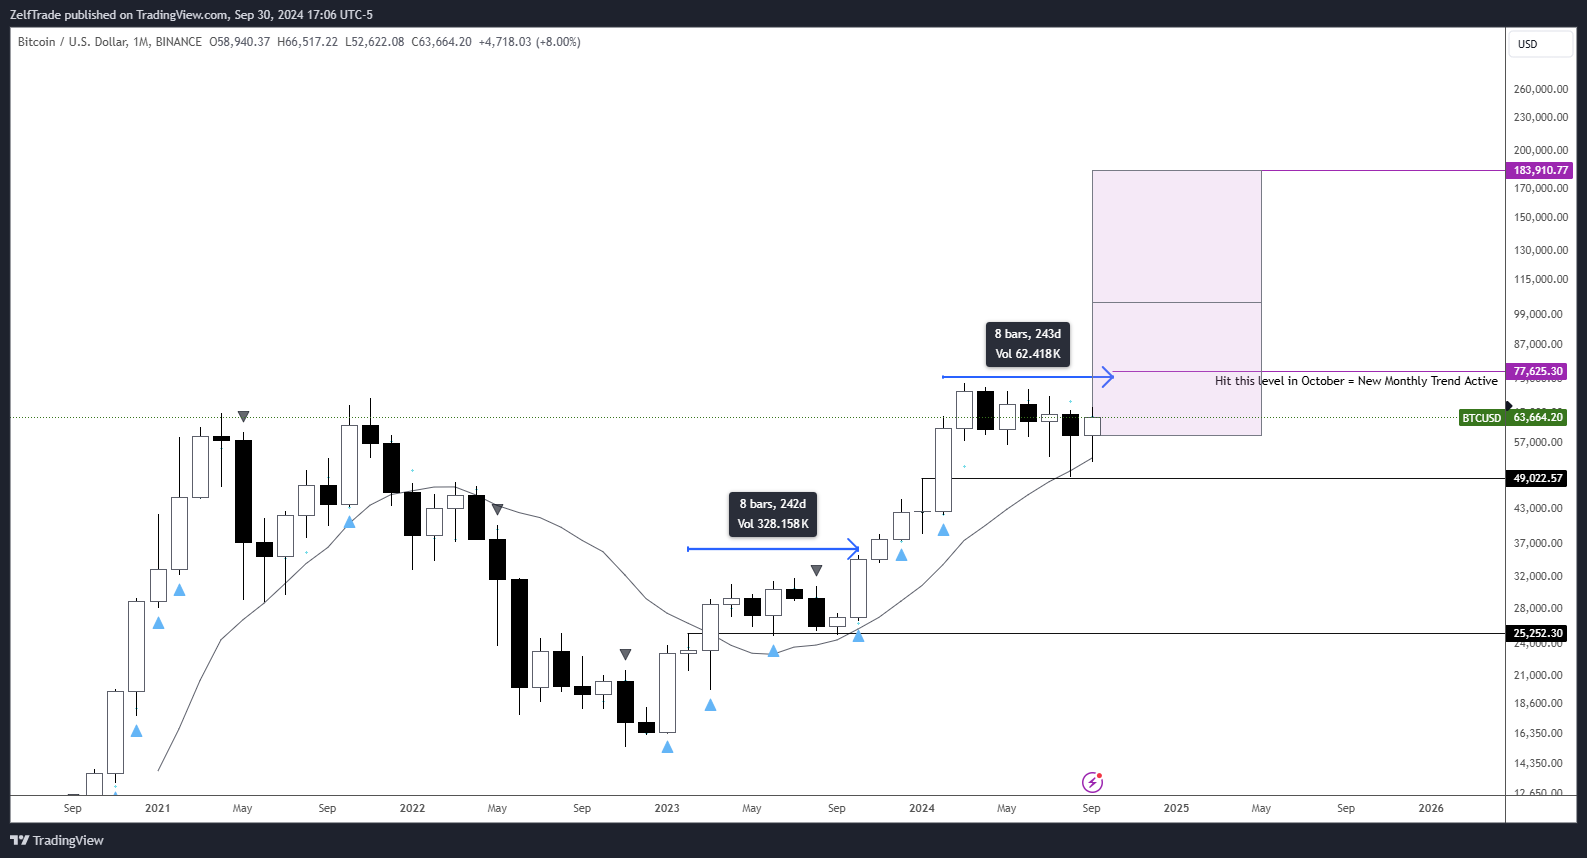
What happens if we hit that level? Simple: we could start a new bullish trend toward all-time highs, potentially sparking a multi-year rally. There’s a hidden consolidation period between the $23k and $42k areas, both showing similar patterns. If this high timeframe setup comes to fruition, we can expect a trending market to unfold between July and October of next year. These are just projections to help gauge market strength, so don’t rush in just yet—confirmation on the monthly chart is still pending. Nevertheless, it’s exciting to see what Bitcoin could potentially offer!
To add some enticing insights, many technical analysts are projecting prices to exceed $100k, with our time@mode methodology indicating $103k as the first target and $181k as a secondary target. While everyone is eager to pinpoint where the next peak will occur, it’s important to remember that this is largely a guessing game.Classical charting may provide some clues, but if the market decides to surge, it will establish a peak when least expected.
Time@Mode Projections
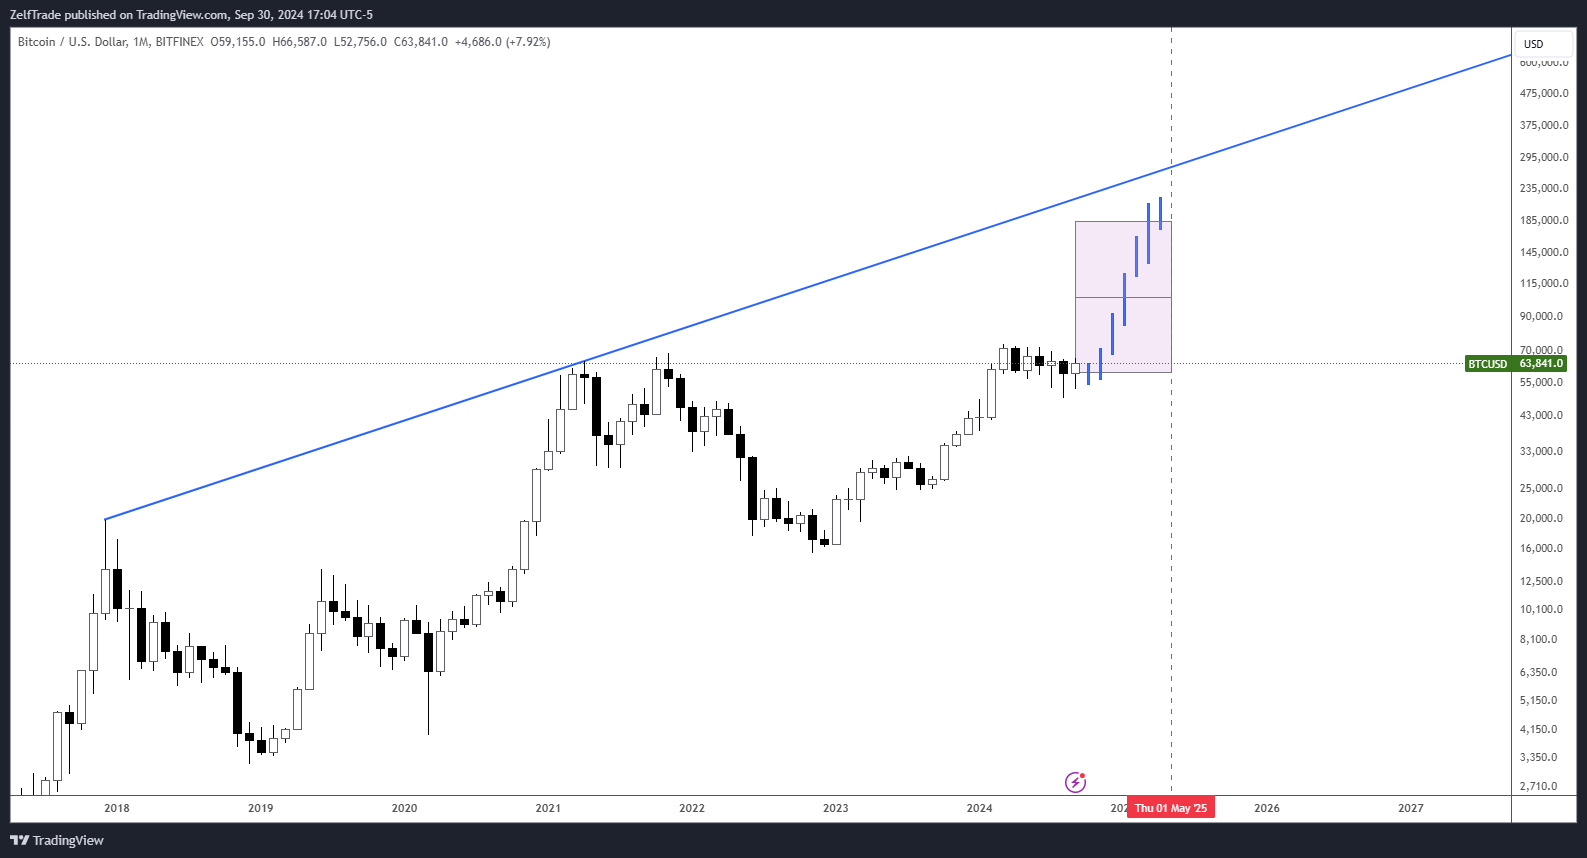
Logarithmic Trend Line
I’ve included a projection line that will likely appear in various charts.
Quick Weekly Chart Review:
- We’ve seen the first break of the bearish BMS, which we've discussed in Telegram and Discord.
- The time@mode is active; although it’s not the usual strength activation signal, it still holds a valid trigger. This month has an active trend (another reason to stay invested) with a target of approximately $77k.
- If we see a retracement this week—which I believe will be the last opportunity for pullbacks before new all-time highs—I expect prices to hold above $60k. If a mode retest occurs, $57.7k might be in play, but I’m not counting on it.
Weekly Bearish BMS
P.S. Check out the fractals of hopium in “The Dip of the Dippity Dip?” post; they align with time@mode targets. Are we really set for a full-year rally?
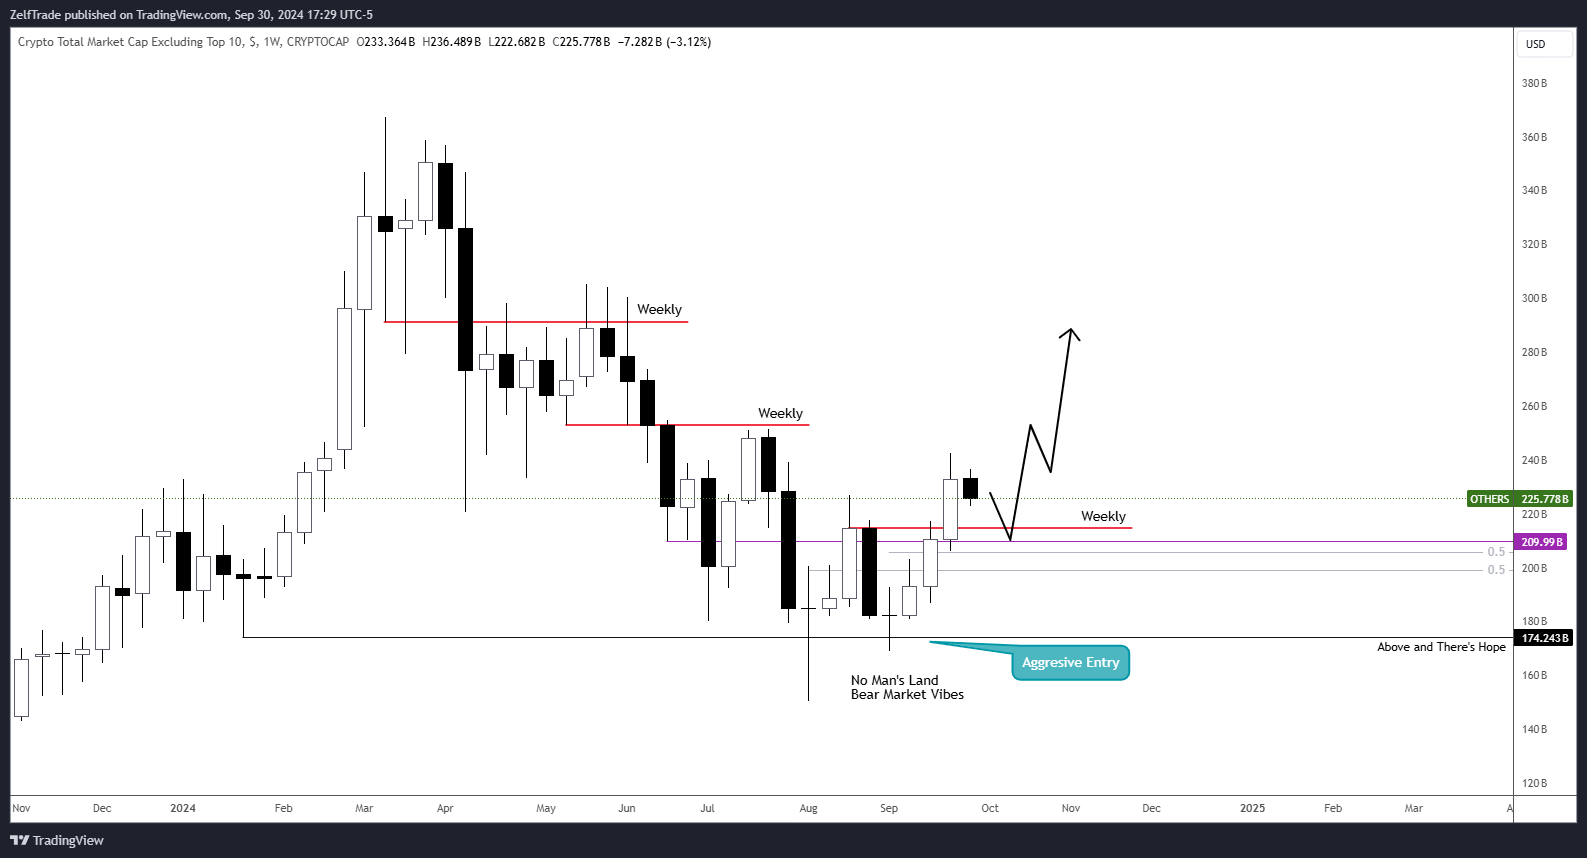
Shifting Focus to the Altcoin Market:
I identified the market's low on the day of the previous post, providing one last opportunity to enter the aggressive buying zone, much like Bitcoin’s swift re-entry at $53k. I hope many of us have dipped our toes in during this window of opportunity. In my opinion, with an active trend, there’s no reason for the market cap to fall below $210 billion.
[
Bitcoin (BTC) - September’s Crucial Test!
The market has had ample time to process the recent significant drop, which, to date, is the most severe crypto market decline since the most recent lows, even exceeding the impact of the FTX collapse in November 2022. Given this context, it’s important to consider what might serve as the
Zelf TradeSamuel CastellanosBitcoin's Swift Re-entry
The altcoin market appears even healthier, showing signs of a quicker reversal pattern compared to Bitcoin. This is no surprise, given the severe distribution it faced over the past seven months. The weekly trend for alts is also stronger than Bitcoin’s, having closed with two consecutive expansion bars. Expect minimal retraces.
OTHERS - Top 125 Cryptocurrencies (Excluding the Top 10
I anticipate quick pullbacks for most altcoins. Don’t expect the typical Fibonacci retracements that everyone draws on their charts; instead, look for minor consolidation periods followed by expansions. Within those periods, aim to bid at the lows of the range.
If the OTHERS market cap dips to $200 billion during this retracement, consider it a gift. While I’m not counting on this scenario, I’ll be more aggressive with my final bids.
Overall, if the August post didn’t look bearish at the lows, you can guess how I’m feeling now. We’re at a tipping point, aiming for new highs and poised for a fresh wave of pumps. Altcoins are looking promising, with a healthier trend than Bitcoin, so I’ll be diversifying into a greater basket of altcoin holdings compared to Bitcoin spot.
But hey, let’s hope we don’t end up in “Downtober” or “Novembear” 🐻_—I think we’ve all had enough of those!_ 😅 Stay tuned for the next post, where I’ll share more details and updates on some of the best altcoin bets as we see confirming reversal signals on the monthly charts! 📈✨
Disclaimer: This content was originally published on Zelf Trade.